Create graphics for utility associations in a utility network.
Use case
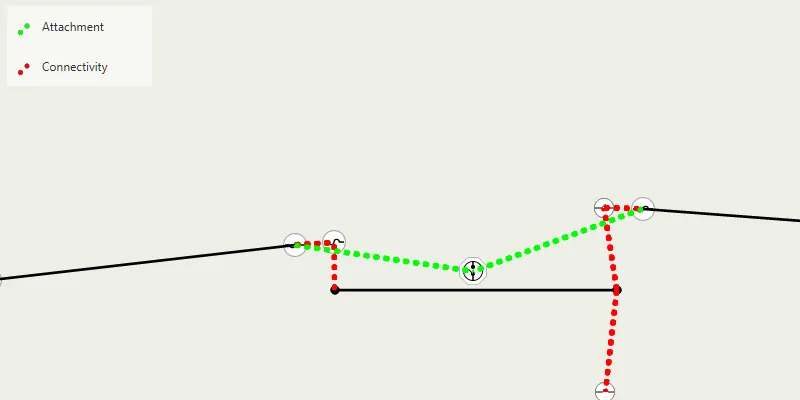
Visualizing utility associations can help you to better understand trace results and the topology of your utility network. For example, connectivity associations allow you to model connectivity between two junctions that don’t have geometric coincidence (are not in the same location); structural attachment associations allow you to model equipment that may be attached to structures; and containment associations allow you to model features contained within other features.
How to use the sample
Pan and zoom around the map. Observe graphics that show utility associations between junctions.
How it works
- Create an
UtilityNetworkwith a feature service URL, add it to theArcGISMap’s utility networks list, then load it. - Add a
FeatureLayerto the map for everyUtilityNetworkSourceof typeEDGEorJUNCTION. - Create a
GraphicsOverlayfor the utility associations. - Add a
NavigationChangedListenerto listen forNavigationChangedEvents. - When the sample starts and every time the viewpoint changes:
- Get the geometry of the map view’s extent.
- Get the associations that are within the current extent using
getAssociationsAsync(extent). - Get the
UtilityAssociationTypefor each association. - Create a
Graphicusing theGeometryproperty of the association and a preferred symbol. - Add the graphic to the graphics overlay.
Relevant API
- GraphicsOverlay
- UtilityAssociation
- UtilityAssociationType
- UtilityNetwork
About the data
The Naperville electrical network feature service, hosted on ArcGIS Online, contains a utility network used to display the utility associations in this sample.
Additional information
Using utility network on ArcGIS Enterprise 10.8 requires an ArcGIS Enterprise member account licensed with the Utility Network user type extension. Please refer to the utility network services documentation.
Tags
associating, association, attachment, connectivity, containment, relationships
Sample code
/* * Copyright 2020 Esri. * Licensed under the Apache License, Version 2.0 (the "License"); * you may not use this file except in compliance with the License. * You may obtain a copy of the License at * * http://www.apache.org/licenses/LICENSE-2.0 * * Unless required by applicable law or agreed to in writing, software * distributed under the License is distributed on an "AS IS" BASIS, * WITHOUT WARRANTIES OR CONDITIONS OF ANY KIND, either express or implied. * See the License for the specific language governing permissions and * limitations under the License. */
package com.esri.samples.display_utility_associations;
import java.util.Arrays;import java.util.Collections;import java.util.List;import java.util.Map;import java.util.concurrent.ExecutionException;
import javafx.application.Application;import javafx.geometry.Insets;import javafx.geometry.Pos;import javafx.scene.Scene;import javafx.scene.control.Alert;import javafx.scene.control.Label;import javafx.scene.image.Image;import javafx.scene.image.ImageView;import javafx.scene.layout.*;import javafx.scene.paint.Color;import javafx.scene.paint.Paint;import javafx.stage.Stage;
import com.esri.arcgisruntime.ArcGISRuntimeEnvironment;import com.esri.arcgisruntime.concurrent.ListenableFuture;import com.esri.arcgisruntime.geometry.Envelope;import com.esri.arcgisruntime.layers.FeatureLayer;import com.esri.arcgisruntime.mapping.ArcGISMap;import com.esri.arcgisruntime.mapping.BasemapStyle;import com.esri.arcgisruntime.mapping.Viewpoint;import com.esri.arcgisruntime.mapping.view.Graphic;import com.esri.arcgisruntime.mapping.view.GraphicsOverlay;import com.esri.arcgisruntime.mapping.view.MapView;import com.esri.arcgisruntime.security.UserCredential;import com.esri.arcgisruntime.symbology.SimpleLineSymbol;import com.esri.arcgisruntime.symbology.UniqueValueRenderer;import com.esri.arcgisruntime.utilitynetworks.UtilityAssociation;import com.esri.arcgisruntime.utilitynetworks.UtilityAssociationType;import com.esri.arcgisruntime.utilitynetworks.UtilityNetwork;import com.esri.arcgisruntime.utilitynetworks.UtilityNetworkSource;
public class DisplayUtilityAssociationsSample extends Application {
  private GraphicsOverlay associationsOverlay;  private MapView mapView;  private UtilityNetwork utilityNetwork;
  @Override  public void start(Stage stage) {
    try {      // create stack pane and application scene      StackPane stackPane = new StackPane();      Scene scene = new Scene(stackPane);
      // set title, size, and add scene to stage      stage.setTitle("Display Utility Associations Sample");      stage.setWidth(800);      stage.setHeight(700);      stage.setScene(scene);      stage.show();
      // authentication with an API key or named user is required to access basemaps and other location services      String yourAPIKey = System.getProperty("apiKey");      ArcGISRuntimeEnvironment.setApiKey(yourAPIKey);
      // create a map with the topographic basemap style      ArcGISMap map = new ArcGISMap(BasemapStyle.ARCGIS_TOPOGRAPHIC);
      // create a viewpoint to focus on the utility networks' extent      Viewpoint viewPoint = new Viewpoint(41.8057655, -88.1489692, 23);
      // set the initial viewpoint      map.setInitialViewpoint(viewPoint);
      // create a map view, set the map, and add the graphics overlay      mapView = new MapView();      mapView.setMap(map);
      // create the utility network      utilityNetwork = new UtilityNetwork("https://sampleserver7.arcgisonline.com/server/rest/services/UtilityNetwork/NapervilleElectric/FeatureServer");
      // set user credentials to authenticate with the service      // NOTE: a licensed user is required to perform utility network operations      UserCredential userCredential = new UserCredential("viewer01", "I68VGU^nMurF");      utilityNetwork.setCredential(userCredential);
      // add the utility network to the map before loading      map.getUtilityNetworks().add(utilityNetwork);      // load the utility network and get all edges and junctions in the network      utilityNetwork.loadAsync();      utilityNetwork.addDoneLoadingListener(() -> {        List<UtilityNetworkSource> networkSources = utilityNetwork.getDefinition().getNetworkSources();
        for (UtilityNetworkSource networkSource : networkSources)          // add all edges that are not subnet lines to the map          if (networkSource.getSourceType() == UtilityNetworkSource.Type.EDGE && networkSource.getSourceUsageType() != UtilityNetworkSource.UsageType.SUBNET_LINE) {            map.getOperationalLayers().add(new FeatureLayer(networkSource.getFeatureTable()));          }          // add all junctions to the map          else if (networkSource.getSourceType() == UtilityNetworkSource.Type.JUNCTION) {            map.getOperationalLayers().add(new FeatureLayer(networkSource.getFeatureTable()));          }
        // add association graphics at the initial view point        addAssociationsGraphics();        // listen for navigation changes        mapView.navigatingProperty().addListener((observable, oldValue, newValue) -> addAssociationsGraphics());      });
      // create labels for the preview      Label attachmentLabel = new Label("Attachment");      Label connectivityLabel = new Label("Connectivity");
      // create symbols for the associations and preview      SimpleLineSymbol attachmentSymbol = new SimpleLineSymbol(SimpleLineSymbol.Style.DOT, Color.LIME, 5);      SimpleLineSymbol connectivitySymbol = new SimpleLineSymbol(SimpleLineSymbol.Style.DOT, Color.RED, 5);
      // create image views for the association symbols to display them in the legend      ImageView attachmentImageView = addSymbolToImageView(attachmentSymbol);      ImageView connectivityImageView = addSymbolToImageView(connectivitySymbol);
      // create a unique value for each association type with the created symbols      UniqueValueRenderer.UniqueValue attachmentUniqueValue = new UniqueValueRenderer.UniqueValue(        "Attachment", "", attachmentSymbol, Collections.singletonList(UtilityAssociationType.ATTACHMENT.toString()));      UniqueValueRenderer.UniqueValue connectivityUniqueValue = new UniqueValueRenderer.UniqueValue(        "Connectivity", "", connectivitySymbol, Collections.singletonList(UtilityAssociationType.CONNECTIVITY.toString()));
      // create a unique value renderer using the values      UniqueValueRenderer uniqueValueRenderer = new UniqueValueRenderer(        Collections.singletonList("AssociationType"), Arrays.asList(attachmentUniqueValue, connectivityUniqueValue), "", null);
      // create a graphics overlay for the associations and set the renderer      associationsOverlay = new GraphicsOverlay();      associationsOverlay.setRenderer(uniqueValueRenderer);      mapView.getGraphicsOverlays().add(associationsOverlay);
      // create a legend      GridPane gridPane = new GridPane();      gridPane.getColumnConstraints().addAll(Arrays.asList(new ColumnConstraints(25), new ColumnConstraints(100)));      gridPane.add(attachmentImageView, 0, 0);      gridPane.add(attachmentLabel, 1, 0);      gridPane.add(connectivityImageView, 0, 1);      gridPane.add(connectivityLabel, 1, 1);      gridPane.setMaxWidth(100);      gridPane.setMaxHeight(80);      gridPane.setBackground(new Background(new BackgroundFill(Paint.valueOf("rgba(255,255,255,0.3)"), CornerRadii.EMPTY,              Insets.EMPTY)));      gridPane.setPadding(new Insets(10));      gridPane.setVgap(20);      gridPane.setAlignment(Pos.CENTER);
      // add the map view and legend to the stack pane      stackPane.getChildren().addAll(mapView, gridPane);      StackPane.setAlignment(gridPane, Pos.TOP_LEFT);      StackPane.setMargin(gridPane, new Insets(10, 0, 0, 10));
    } catch (Exception e) {      // on any error, display the stack trace      e.printStackTrace();    }  }
  /**   * Get the utility association type for each association within the extent, create graphics and add it to the graphics overlay.   */  private void addAssociationsGraphics() {    try {      // if the current viewpoint is within the max scale, add association graphics      if (!(mapView.getCurrentViewpoint(Viewpoint.Type.CENTER_AND_SCALE).getTargetScale() >= 2000)) {        // check if the current viewpoint has an extent        Envelope extent = mapView.getCurrentViewpoint(Viewpoint.Type.BOUNDING_GEOMETRY).getTargetGeometry().getExtent();        if (extent != null) {
          // get all the associations in the extent of the viewpoint          ListenableFuture<List<UtilityAssociation>> associationsFuture = utilityNetwork.getAssociationsAsync(extent);          associationsFuture.addDoneListener(() -> {            try {              List<UtilityAssociation> associations = associationsFuture.get();
              // iterate through all associations              associations.forEach(association -> {
                // check if the graphics overlay already contains the association                if (associationsOverlay.getGraphics().stream().noneMatch(graphic ->                  graphic.getAttributes().containsKey("GlobalId")                    && graphic.getAttributes().get("GlobalId") == association.getGlobalId())                  && association.getGeometry() != null) {
                  // create attributes for the graphic so that the renderers display the appropriate symbol                  Map<String, Object> attributes = Map.of(                    "GlobalId", association.getGlobalId(),                    "AssociationType", association.getAssociationType().toString());
                  // create and add the graphic for the association                  Graphic newGraphic = new Graphic(association.getGeometry(), attributes);                  associationsOverlay.getGraphics().add(newGraphic);                }              });              // this is thrown when there are too many associations in the extent            } catch (InterruptedException | ExecutionException e) {              Alert alert = new Alert(Alert.AlertType.ERROR, e.getMessage());              alert.setResizable(true);              alert.show();            }          });        }      }    } catch (Exception e) {      new Alert(Alert.AlertType.ERROR, e.getMessage()).show();    }  }
  /**   * Returns an imageView populated with a symbol.   *   * @param symbol the symbol to display in the imageView   * @return imageView the imageView populated with the symbol   */  private ImageView addSymbolToImageView(SimpleLineSymbol symbol) {
    // add the connectivity symbol to the image view to display it in the legend    ImageView imageView = new ImageView();    ListenableFuture<Image> connectivityImage = symbol.createSwatchAsync(Color.TRANSPARENT);    connectivityImage.addDoneListener(() -> {      try {        // display the image in the image view        imageView.setImage(connectivityImage.get());      } catch (InterruptedException | ExecutionException e) {        new Alert(Alert.AlertType.ERROR, "Error creating preview ImageView from provided symbol").show();      }    });    return imageView;  }
  /**   * Stops and releases all resources used in application.   */  @Override  public void stop() {
    if (mapView != null) {      mapView.dispose();    }  }
  /**   * Opens and runs application.   *   * @param args arguments passed to this application   */  public static void main(String[] args) {
    Application.launch(args);  }}