 Hide Table of Contents
 Analysis
 Dynamic Layers
 Editing
 Feature Layers
 Feature Table
 Graphics
 Map
Map
 Mobile
 Online and Portal
 Popups and Info Windows
 Query and Select
 Renderers, Symbols, Visualization
 Search

Filter features with clustering enabled
Explore in the sandbox
Open in CodePen
View live sample
Description
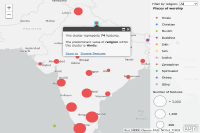
This sample demonstrates how a layer with a UniqueValueRenderer is visualized when featureReduction (e.g. clustering) is enabled. It also shows how the clustering visualization is impacted when filters, or definitionExpressions are set on the layer. Filtering features with clustering enabled can help reveal patterns not easily discernible without any applied aggregation method.
Support for feature reduction is limited to the following scenarios:
- The map must have a spatial reference of Web Mercator or WGS84.
- FeatureLayer or CSVLayer with point geometries fewer than 50,000 features.
- FeatureLayer created from a service URL must point to a service that supports pagination.
- When editing is initiated with the Editor widget, then feature reduction is disabled until the Editor widget is destroyed.
Code
<!DOCTYPE html>
<html>

<head>

<meta http-equiv="Content-Type" content="text/html; charset=utf-8">
<meta name="viewport" content="initial-scale=1,maximum-scale=1,user-scalable=no"/>
<title>Set definition expression on cluster-enabled layer</title>

<link rel="stylesheet" href="https://js.arcgis.com/3.46/esri/css/esri.css">
<script src="https://js.arcgis.com/3.46/"></script>

<style>
  html, body, #viewDiv {
    height: 100%;
    width: 100%;
    margin: 0;
    padding: 0;
  }

  #infoDiv{
    top: 0px;
    right: 0px;
    position: absolute;
    z-index: 2;
    opacity: 0.9;
    background-color: whitesmoke;
    padding: 8px;
    font-family: Verdana, Geneva, Arial, Helvetica, sans-serif;
    font-size: 12px;
  }
</style>


<script>
  require([
    "esri/map",
    "esri/layers/FeatureLayer",
    "esri/dijit/PopupTemplate",
    "esri/dijit/Legend",
    "dojo/domReady!"
  ], function(Map, FeatureLayer, PopupTemplate, Legend
  ) {

    var map = new Map("viewDiv", {
      basemap: "gray-vector",
      center: [ 80.20127, 22.12355 ],
      zoom: 4
    });

    // Enable clustering on the layer and add it to the map

    var serviceUrl = "https://services.arcgis.com/V6ZHFr6zdgNZuVG0/arcgis/rest/services/Places_of_Worship_India/FeatureServer/0";
    var layer = new FeatureLayer(serviceUrl, {
      outFields: [ "name", "religion", "denomination" ],
      featureReduction: {
        type: "cluster"
      },
      infoTemplate: new PopupTemplate({
        title: "{name}",
        description: "Religion: {religion}"
          + "<br>Denomination: {denomination}"
      })
    });
    map.addLayer(layer);

    map.on("load", function(evt){
      var legend = new Legend({
        map: map,
        layerInfos: [{
          layer: layer,
          title: "Places of worship"
        }]
      }, "legendDiv");
      legend.startup();

      var filter = document.getElementById("filter");
      // filters the layer using a definitionExpression
      // based on a religion selected by the user
      filter.addEventListener("change", function(event){
        var newValue = event.target.value;
        updateDefinitionExpression(newValue);
      });
    });

    function updateDefinitionExpression(value){
      var definitionExpression = value ? "religion = '" + value + "'" : null;
      layer.setDefinitionExpression(definitionExpression);
      map.infoWindow.hide();
    }

  });

</script>

</head>

<body>
  <div id="viewDiv"></div>
  <div id="infoDiv">
    Filter by religion:
    <select id="filter">
      <option value="">All</option>
      <option value="hindu">Hindu</option>
      <option value="christian">Christian</option>
      <option value="muslim">Muslim</option>
      <option value="buddhist">Buddhist</option>
      <option value="sikh">Sikh</option>
      <option value="jain">Jain</option>
    </select>
    <div id="legendDiv"></div>
  </div>
</body>

</html>