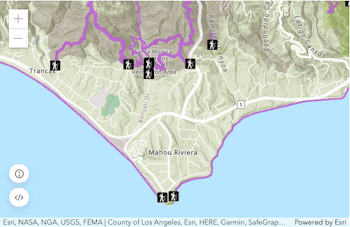
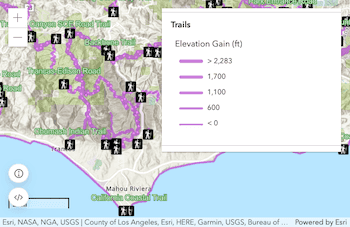
This sample demonstrates how to indicate the levels of detail (LODs) at which cached, or tiled, services in your map will be shown. When you open the sample map, you'll see some imagery from the ArcGIS Online ESRI_Imagery_World_2D layer. This application has configured the imagery to be visible from LODs 0 - 11 only, even though imagery exists at other levels in the source cache. Zoom directly in and you'll eventually switch to detailed user-contributed imagery from the ArcGIS Online CSP_Imagery_World_2D layer. The application is configured so that the user-contributed imagery is only visible at LODs 12 - 17.
This sample creates one set of LODs for the map that unions the LODs in the participating cached services. In versions of the ArcGIS JavaScript API prior to 1.2, you could only use the LODs from the first service that you added. Notice how the displayLevels[] set in the ArcGISTiledMapServiceLayerconstructor translate to the layer's tileInfo.lods. Later, these are concatenated into one custom set of LODs for the map (customLods[]).
You might have your own set of data that you want to display when zoomed in, while displaying ArcGIS Online data or some other data when zoomed out. To perform this type of layer switching, matching tiling schemes are required. Both services in this example use the ArcGIS Online tiling scheme.
<!DOCTYPE html> <html> <head> <meta http-equiv="Content-Type" content="text/html; charset=utf-8"> <meta name="viewport" content="width=device-width,initial-scale=1,maximum-scale=1,minimum-scale=1,user-scalable=no"> <meta name="apple-mobile-web-app-capable" content="yes" /> <title>Display Different Map Services Based on Zoom Level</title> <link rel="stylesheet" href="https://js.arcgis.com/3.46/dijit/themes/claro/claro.css"> <link rel="stylesheet" href="https://js.arcgis.com/3.46/esri/css/esri.css"> <style> html, body, #mapDiv { padding: 0; margin: 0; height: 100%; } </style> <script src="https://js.arcgis.com/3.46/"></script> <script> var map; // The satellite layer will be visible at zoom levels 0 - 11. // The streets layer will be visible at zoom levels 11 - 15. // // Both are visible at zoom level 11. require([ "esri/map", "esri/layers/ArcGISTiledMapServiceLayer", "dojo/dom", "dojo/domReady!" ], function( Map, ArcGISTiledMapServiceLayer, dom ) { var customLods = []; var loadCount = 0; // satellite imagery from ArcGIS Online, use levels 0 - 11 var satellite = new ArcGISTiledMapServiceLayer("https://services.arcgisonline.com/ArcGIS/rest/services/World_Imagery/MapServer", { displayLevels: [0, 1, 2, 3, 4, 5, 6, 7, 8, 9, 10, 11] }); satellite.on("load", addLods); // street Map service from ArcGIS Online, use levels 11 - 15 var streets = new ArcGISTiledMapServiceLayer("https://services.arcgisonline.com/ArcGIS/rest/services/World_Street_Map/MapServer", { displayLevels: [11, 12, 13, 14, 15 ], opacity : 0.75 }); streets.on("load", addLods); // popuplate an array with zoom levels function addLods(evt) { customLods = customLods.concat(evt.layer.tileInfo.lods); loadCount++; if (loadCount === 2) { initMap(); } } // create the map and use the custom zoom levels function initMap() { map = new Map("mapDiv", { center: [-81.1, 34.93], zoom: 9, lods : customLods }); map.on("extent-change", changeScale); map.addLayer(satellite); map.addLayer(streets); } //Report which layer is being shown function changeScale(evt) { dom.byId("scale").innerHTML = "Level: <i>" + evt.lod.level; if (evt.lod.level < 11) { dom.byId("visibleLayer").innerHTML = "Layer: <i>Imagery</i>"; } else if (evt.lod.level == 11) { // both layers are loaded dom.byId("visibleLayer").innerHTML = "<i>Both layers currently visible</i>"; } else { dom.byId("visibleLayer").innerHTML = "Layer: <i>Streets</i>"; } } }); </script> </head> <body> <div id="mapDiv"> <span id="scale" style="position:absolute; left:30px; bottom:30px; z-index:100; color:yellow; font-size: 150%;"></span> <span id="visibleLayer" style="position:absolute; left:30px; bottom:5px; z-index:100; color:yellow; font-size: 150%;"></span> </div> </body> </html>