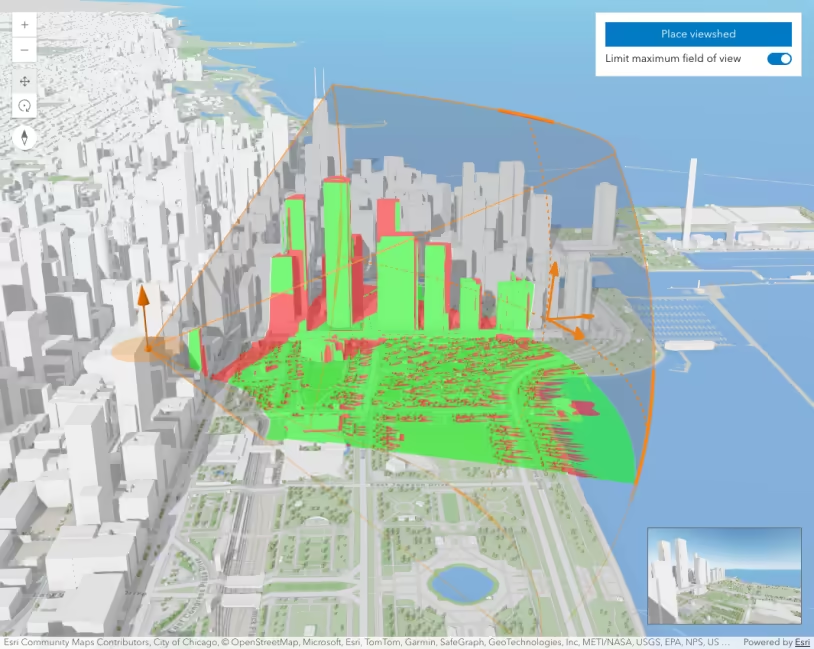
This sample demonstrates how to use the geoprocessor to calculate a viewshed. Click any point on the map to see all areas that are visible within a 5 mile radius. It may take a few seconds for the model to run and send back the results.
The viewshed calculation is accomplished through an ArcGIS Server Geoprocessing service. The service provides access to a model on the server that includes the viewshed tool. The geoprocessor method requires the URL of the service. You can use the Services Directory to discover the URLs to your own geoprocessing services and the methods within them.
How it works
When the map is clicked, an event listener calls the function computeViewshed(), which adds a SimpleMarkerSymbol at the location of the click. The function also sets up the two parameters necessary for the method. The first parameter is the point clicked and the second parameter is the radius of the viewshed.
The next step is to pass the parameters to the geoprocessor and execute() to perform the method synchronously. Note that submitJob() can also be called to run the method asynchronously. The execute method returns a promise which can be used with the .then() method to define a callback, in this case drawResultData.
const params = { Input_Observation_Point: featureSet, Viewshed_Distance: vsDistance,};const options = { outSpatialReference: { wkid: 102100, },};geoprocessor.execute(gpUrl, params, options).then(drawResultData);The drawResultData callback function obtains the features stored within the result object, iterates through them and applies a symbol to each graphic. The view then animates to the resulting array of graphics.
const resultFeatures = result.results[0].value.features;
// Assign each resulting graphic a symbolconst viewshedGraphics = resultFeatures.map((feature) => {  feature.symbol = fillSymbol;  return feature;});
// Add the resulting graphics to the graphics layergraphicsLayer.addMany(viewshedGraphics);
viewElement.goTo({  target: viewshedGraphics,  tilt: 0,});