Current version: 300.0 - April 2026. Release notes.
Welcome to ArcGIS Maps SDK for .NET. This guide describes how to use the latest version of ArcGIS Maps SDK for .NET to build native desktop and mobile apps that incorporate capabilities such as 2D and 3D data visualization, geocoding
Where to start
-
Discover key features of the SDK.
-
Install and set up the SDK.
-
Explore the tutorials and sample code.

Tutorials
Follow step-by-step instructions to build apps that incorporate key features of ArcGIS Maps SDK for .NET.

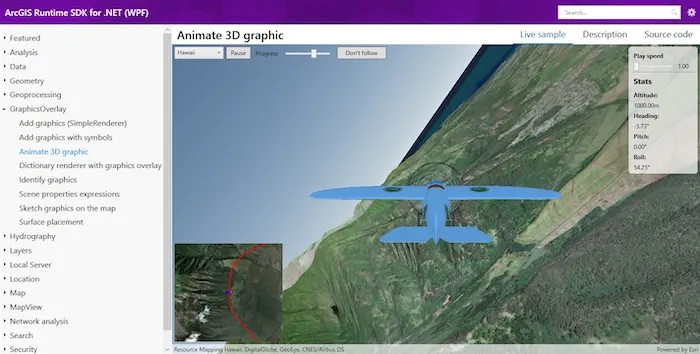
Sample code
Review sample code in our complete sample directory, or download all the code from our GitHub repository. Interact with live samples using the sample viewer app.
Open source toolkit
The open source ArcGIS Maps SDK for .NET Toolkit contains UI components and utilities that will help simplify your .NET app development.
From our videos
Take a look at some of our highlights.

ArcGIS Maps SDK for .NET: An Introduction
Learn how to start developing with the ArcGIS Maps SDK for .NET.

ArcGIS Maps SDK for .NET: Building .NET MAUI Apps
Learn how to build cross-platform applications using .NET MAUI.

The Developer Story
Get an overview of what ArcGIS has to offer developers and how to leverage location and mapping capabilities.