Perform an interactive viewshed analysis to determine visible and non-visible areas from a given observer position.
Use case
A viewshed analysis calculates the visible and non-visible areas from an observer’s location, based on factors such as elevation and topographic features. For example, an interactive viewshed analysis can be used to identify which areas can be seen from a helicopter moving along a given flight path for monitoring wildfires while taking parameters such as height, field of view, and heading into account to give immediate visual feedback. A user could further extend their viewshed analysis calculations by using map algebra to e.g. only return viewshed results in geographical areas not covered in forest if they have an additional land cover raster dataset.
Note: This analysis is a form of “data-driven analysis”, which means the analysis is calculated at the resolution of the data rather than the resolution of the display.
How to use the sample
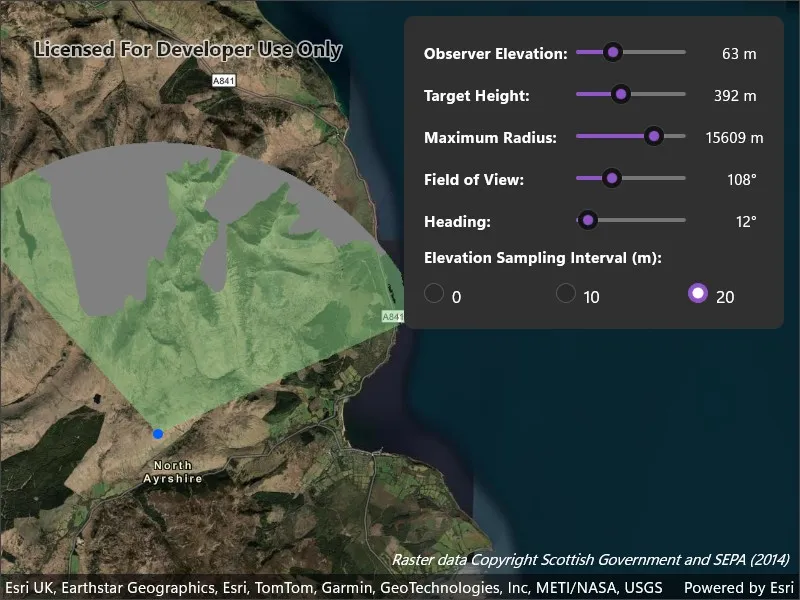
The sample loads with a viewshed analysis initialized from an elevation raster covering the Isle of Arran, Scotland. Transparent green shows the area visible from the observer position, and grey shows the non-visible areas. Move the observer position by clicking and dragging over the island to interactively evaluate the viewshed result and display it in the analysis overlay. Alternatively, tap on the map to see the viewshed from the tapped location. Use the control panel to explore how the viewshed analysis results change when adjusting the observer elevation, target height, maximum radius, field of view, heading and elevation sampling interval. As you move the observer and update the viewshed parameters, the analysis overlay refreshes to show the evaluated viewshed result.
How it works
- Create a
Mapand set it on aMapView. - Add a
GraphicsOverlayto draw the observer point and anAnalysisOverlayto the map view. - Create a
ContinuousFieldfrom a raster file containing elevation data. - Create and configure
ViewshedParameters, passing in aMapPointas the observer position for the viewshed. - Create a
ContinuousFieldFunctionfrom the continuous field. - Create a
ViewshedFunctionusing the continuous field function and viewshed parameters, then convert it to aDiscreteFieldFunction. - Create a
ColormapRendererfrom aColormapwith colors that represent visible and non-visible results. - Create a
FieldAnalysisfrom the discrete field function and colormap renderer, then add it to theAnalysisOverlay’s collection of analysis objects to display the results. As parameter values change, the result is recalculated and redrawn automatically.
Relevant API
- AnalysisOverlay
- Colormap
- ColormapRenderer
- ContinuousField
- ContinuousFieldFunction
- DiscreteFieldFunction
- FieldAnalysis
- ViewshedFunction
- ViewshedParameters
About the data
The sample uses a 10m resolution digital terrain elevation raster of the Isle of Arran, Scotland (Data Copyright Scottish Government and SEPA (2014)).
Tags
analysis overlay, elevation, field analysis, interactive, raster, spatial analysis, terrain, viewshed, visibility
Sample code
// Copyright 2026 Esri.//// Licensed under the Apache License, Version 2.0 (the "License"); you may not use this file except in compliance with the License.// You may obtain a copy of the License at: http://www.apache.org/licenses/LICENSE-2.0//// Unless required by applicable law or agreed to in writing, software distributed under the License is distributed on an// "AS IS" BASIS, WITHOUT WARRANTIES OR CONDITIONS OF ANY KIND, either express or implied. See the License for the specific// language governing permissions and limitations under the License.
using ArcGIS.Samples.Managers;using Esri.ArcGISRuntime.Analysis;using Esri.ArcGISRuntime.Analysis.Visibility;using Esri.ArcGISRuntime.Geometry;using Esri.ArcGISRuntime.Mapping;using Esri.ArcGISRuntime.Rasters;using Esri.ArcGISRuntime.Symbology;using Esri.ArcGISRuntime.UI;using Esri.ArcGISRuntime.UI.GeoAnalysis;using Colors = System.Drawing.Color;using GeoViewInputEventArgs = Esri.ArcGISRuntime.Maui.GeoViewInputEventArgs;using Point = Microsoft.Maui.Graphics.Point;
namespace ArcGIS.Samples.ShowInteractiveViewshedInAnalysisOverlay{    [ArcGIS.Samples.Shared.Attributes.Sample(        name: "Show interactive viewshed with analysis overlay",        category: "Analysis",        description: "Perform an interactive viewshed analysis to determine visible and non-visible areas from a given observer position.",        instructions: "The sample loads with a viewshed analysis initialized from an elevation raster covering the Isle of Arran, Scotland. Transparent green shows the area visible from the observer position, and grey shows the non-visible areas. Move the observer position by clicking and dragging over the island to interactively evaluate the viewshed result and display it in the analysis overlay. Alternatively, tap on the map to see the viewshed from the tapped location. Use the control panel to explore how the viewshed analysis results change when adjusting the observer elevation, target height, maximum radius, field of view, heading and elevation sampling interval. As you move the observer and update the viewshed parameters, the analysis overlay refreshes to show the evaluated viewshed result.",        tags: new[] { "analysis overlay", "elevation", "field analysis", "interactive", "raster", "spatial analysis", "terrain", "viewshed", "visibility" })]    [ArcGIS.Samples.Shared.Attributes.OfflineData("aa97788593e34a32bcaae33947fdc271")]    public partial class ShowInteractiveViewshedInAnalysisOverlay : ContentPage    {        private ViewshedParameters _viewshedParameters;        private Graphic _observerGraphic;        private MapPoint _observerPosition;        private PointerGestureRecognizer _pointerGesture;        private bool _isInitialized;        private bool _isDragging;        private double _observerElevation = 20.0;
        private readonly SimpleMarkerSymbol _observerSymbol = new SimpleMarkerSymbol(            SimpleMarkerSymbolStyle.Circle, Colors.FromArgb(255, 0, 94, 255), 10);
        public ShowInteractiveViewshedInAnalysisOverlay()        {            InitializeComponent();            _ = Initialize();        }
        private async Task Initialize()        {            // Create a map with the imagery basemap style.            MyMapView.Map = new Map(BasemapStyle.ArcGISImagery)            {                InitialViewpoint = new Viewpoint(55.610000, -5.200346, 100000)            };
            // Disable panning so pointer drags are used solely for placing the observer.            MyMapView.InteractionOptions = new MapViewInteractionOptions { IsPanEnabled = false };
            // Subscribe to tap events for moving the observer (touch fallback).            MyMapView.GeoViewTapped += MyMapView_GeoViewTapped;
            // Add a pointer gesture recognizer for click-and-drag observer placement on desktop.            _pointerGesture = new PointerGestureRecognizer();            _pointerGesture.PointerPressed += MapView_PointerPressed;            _pointerGesture.PointerMoved += MapView_PointerMoved;            _pointerGesture.PointerReleased += MapView_PointerReleased;            _pointerGesture.PointerExited += MapView_PointerExited;            MyMapView.GestureRecognizers.Add(_pointerGesture);
            // Create and add a graphics overlay for the observer marker.            var graphicsOverlay = new GraphicsOverlay();            MyMapView.GraphicsOverlays.Add(graphicsOverlay);
            // Create and add an analysis overlay for the viewshed.            var analysisOverlay = new AnalysisOverlay();            MyMapView.AnalysisOverlays.Add(analysisOverlay);
            try            {                // Get the path to the locally stored elevation raster file.                string rasterPath = DataManager.GetDataFolder("aa97788593e34a32bcaae33947fdc271", "arran.tif");
                // Create a continuous field from the elevation raster file.                var continuousField = await ContinuousField.CreateAsync(new[] { rasterPath }, 0);
                // Set the initial observer position over the Isle of Arran.                _observerPosition = new MapPoint(-579246.504, 7479619.947, _observerElevation, SpatialReferences.WebMercator);
                // Add the observer graphic.                _observerGraphic = new Graphic(_observerPosition, _observerSymbol);                graphicsOverlay.Graphics.Add(_observerGraphic);
                // Configure the viewshed parameters.                _viewshedParameters = new ViewshedParameters                {                    ObserverPosition = _observerPosition,                    TargetHeight = 20.0,                    MaxRadius = 8000,                    FieldOfView = 150,                    Heading = 10,                    ElevationSamplingInterval = 0                };
                // Create a ContinuousFieldFunction from the continuous field.                var continuousFieldFunction = ContinuousFieldFunction.Create(continuousField);
                // Create a ViewshedFunction and convert to a DiscreteFieldFunction for visible/not-visible classification.                var viewshedFunction = new ViewshedFunction(continuousFieldFunction, _viewshedParameters);                var discreteViewshed = viewshedFunction.ToDiscreteFieldFunction();
                // Create a colormap renderer with visible/not-visible colors.                var colors = new[]                {                    Colors.Gray,                                      // Not visible                    Colors.FromArgb(128, 136, 204, 132)  // Visible (translucent green)                };                var colormap = Colormap.Create(colors);                var colormapRenderer = new ColormapRenderer(colormap);
                // Create a field analysis with the discrete viewshed function and renderer.                var fieldAnalysis = new FieldAnalysis(discreteViewshed, colormapRenderer);
                // Add the field analysis to the overlay.                analysisOverlay.Analyses.Add(fieldAnalysis);
                _isInitialized = true;
                // Clean up event handlers when the sample is unloaded.                Unloaded += SampleUnloaded;            }            catch (Exception ex)            {                await Application.Current.Windows[0].Page.DisplayAlert("Error initializing viewshed", ex.Message, "OK");            }        }
        private void SampleUnloaded(object sender, EventArgs e)        {            MyMapView.GeoViewTapped -= MyMapView_GeoViewTapped;
            if (_pointerGesture != null)            {                _pointerGesture.PointerPressed -= MapView_PointerPressed;                _pointerGesture.PointerMoved -= MapView_PointerMoved;                _pointerGesture.PointerReleased -= MapView_PointerReleased;                _pointerGesture.PointerExited -= MapView_PointerExited;                MyMapView.GestureRecognizers.Remove(_pointerGesture);                _pointerGesture = null;            }        }
        // Update the observer position when the user taps on the map.        private void MyMapView_GeoViewTapped(object sender, GeoViewInputEventArgs e)        {            if (!_isInitialized || e.Location == null) return;
            SetObserverPosition(e.Location.X, e.Location.Y);        }
        // Begin dragging and place the observer at the pressed location.        private void MapView_PointerPressed(object sender, PointerEventArgs e)        {            if (!_isInitialized) return;            _isDragging = true;            UpdateObserverFromPointer(e);        }
        // Update the observer position as the pointer moves while dragging.        private void MapView_PointerMoved(object sender, PointerEventArgs e)        {            if (!_isInitialized || !_isDragging) return;            UpdateObserverFromPointer(e);        }
        // Finish dragging when the pointer is released.        private void MapView_PointerReleased(object sender, PointerEventArgs e)        {            _isDragging = false;        }
        // Stop dragging if the pointer leaves the map view.        private void MapView_PointerExited(object sender, PointerEventArgs e)        {            _isDragging = false;        }
        // Convert the pointer's screen position to a map location and update the observer.        private void UpdateObserverFromPointer(PointerEventArgs e)        {            Point? screenPoint = e.GetPosition(MyMapView);            if (screenPoint is null) return;
            MapPoint mapPoint = MyMapView.ScreenToLocation(screenPoint.Value);            if (mapPoint == null || double.IsNaN(mapPoint.X) || double.IsNaN(mapPoint.Y)) return;
            SetObserverPosition(mapPoint.X, mapPoint.Y);        }
        // Update the observer position and viewshed parameters with the new coordinates.        private void SetObserverPosition(double x, double y)        {            _observerPosition = new MapPoint(x, y, _observerElevation, SpatialReferences.WebMercator);            _viewshedParameters.ObserverPosition = _observerPosition;            _observerGraphic.Geometry = _observerPosition;        }
        // Update the observer elevation and reposition the observer when the slider value changes.        private void OnObserverElevationChanged(object sender, ValueChangedEventArgs e)        {            if (!_isInitialized || _observerPosition == null) return;            ObserverElevationValue.Text = $"{ObserverElevationSlider.Value:0} m";            _observerElevation = e.NewValue;            SetObserverPosition(_observerPosition.X, _observerPosition.Y);        }
        // Update the viewshed parameters when slider values change.        private void OnViewshedParameterChanged(object sender, ValueChangedEventArgs e)        {            if (!_isInitialized) return;
            TargetHeightValue.Text = $"{TargetHeightSlider.Value:0} m";            MaxRadiusValue.Text = $"{MaxRadiusSlider.Value:0} m";            FieldOfViewValue.Text = $"{FieldOfViewSlider.Value:0}\u00b0";            HeadingValue.Text = $"{HeadingSlider.Value:0}\u00b0";
            _viewshedParameters.TargetHeight = TargetHeightSlider.Value;            _viewshedParameters.MaxRadius = MaxRadiusSlider.Value;            _viewshedParameters.FieldOfView = FieldOfViewSlider.Value;            _viewshedParameters.Heading = HeadingSlider.Value;        }
        // Update the elevation sampling interval when a radio button is selected.        private void OnSamplingIntervalChanged(object sender, CheckedChangedEventArgs e)        {            if (!_isInitialized || !e.Value) return;
if (SamplingInterval0Radio.IsChecked) _viewshedParameters.ElevationSamplingInterval = 0; else if (SamplingInterval10Radio.IsChecked) _viewshedParameters.ElevationSamplingInterval = 10; else if (SamplingInterval20Radio.IsChecked) _viewshedParameters.ElevationSamplingInterval = 20; } }}<?xml version="1.0" encoding="utf-8" ?><ContentPage x:Class="ArcGIS.Samples.ShowInteractiveViewshedInAnalysisOverlay.ShowInteractiveViewshedInAnalysisOverlay" xmlns="http://schemas.microsoft.com/dotnet/2021/maui" xmlns:x="http://schemas.microsoft.com/winfx/2009/xaml" xmlns:esriUI="clr-namespace:Esri.ArcGISRuntime.Maui;assembly=Esri.ArcGISRuntime.Maui"> <Grid Style="{DynamicResource EsriSampleContainer}"> <esriUI:MapView x:Name="MyMapView" Style="{DynamicResource EsriSampleGeoView}" /> <Border MaximumWidthRequest="460" MinimumWidthRequest="380" Style="{DynamicResource EsriSampleControlPanel}"> <ScrollView> <Grid Padding="8,6" ColumnDefinitions="Auto,3*,Auto" ColumnSpacing="6" RowDefinitions="Auto,Auto,Auto,Auto,Auto,Auto,Auto" RowSpacing="2">
<Label Grid.Row="0" Grid.Column="0" FontAttributes="Bold" FontSize="12" LineBreakMode="NoWrap" Text="Observer Elevation:" VerticalTextAlignment="Center" /> <Slider x:Name="ObserverElevationSlider" Grid.Row="0" Grid.Column="1" Maximum="200" Minimum="2" ValueChanged="OnObserverElevationChanged" Value="20" /> <Label x:Name="ObserverElevationValue" Grid.Row="0" Grid.Column="2" FontSize="12" HorizontalTextAlignment="End" Text="20 m" VerticalTextAlignment="Center" WidthRequest="55" />
<Label Grid.Row="1" Grid.Column="0" FontAttributes="Bold" FontSize="12" LineBreakMode="NoWrap" Text="Target Height:" VerticalTextAlignment="Center" /> <Slider x:Name="TargetHeightSlider" Grid.Row="1" Grid.Column="1" Maximum="1000" Minimum="2" ValueChanged="OnViewshedParameterChanged" Value="20" /> <Label x:Name="TargetHeightValue" Grid.Row="1" Grid.Column="2" FontSize="12" HorizontalTextAlignment="End" Text="20 m" VerticalTextAlignment="Center" WidthRequest="55" />
<Label Grid.Row="2" Grid.Column="0" FontAttributes="Bold" FontSize="12" LineBreakMode="NoWrap" Text="Maximum Radius:" VerticalTextAlignment="Center" /> <Slider x:Name="MaxRadiusSlider" Grid.Row="2" Grid.Column="1" Maximum="20000" Minimum="2500" ValueChanged="OnViewshedParameterChanged" Value="8000" /> <Label x:Name="MaxRadiusValue" Grid.Row="2" Grid.Column="2" FontSize="12" HorizontalTextAlignment="End" Text="8000 m" VerticalTextAlignment="Center" WidthRequest="70" />
<Label Grid.Row="3" Grid.Column="0" FontAttributes="Bold" FontSize="12" LineBreakMode="NoWrap" Text="Field of View:" VerticalTextAlignment="Center" /> <Slider x:Name="FieldOfViewSlider" Grid.Row="3" Grid.Column="1" Maximum="360" Minimum="5" ValueChanged="OnViewshedParameterChanged" Value="150" /> <Label x:Name="FieldOfViewValue" Grid.Row="3" Grid.Column="2" FontSize="12" HorizontalTextAlignment="End" Text="150°" VerticalTextAlignment="Center" WidthRequest="55" />
<Label Grid.Row="4" Grid.Column="0" FontAttributes="Bold" FontSize="12" LineBreakMode="NoWrap" Text="Heading:" VerticalTextAlignment="Center" /> <Slider x:Name="HeadingSlider" Grid.Row="4" Grid.Column="1" Maximum="360" Minimum="0" ValueChanged="OnViewshedParameterChanged" Value="10" /> <Label x:Name="HeadingValue" Grid.Row="4" Grid.Column="2" FontSize="12" HorizontalTextAlignment="End" Text="10°" VerticalTextAlignment="Center" WidthRequest="55" />
<Label Grid.Row="5" Grid.Column="0" Grid.ColumnSpan="3" FontAttributes="Bold" FontSize="12" Text="Elevation Sampling Interval (m):" VerticalTextAlignment="Center" />
<HorizontalStackLayout Grid.Row="6" Grid.Column="0" Grid.ColumnSpan="3" Spacing="12"> <RadioButton x:Name="SamplingInterval0Radio" CheckedChanged="OnSamplingIntervalChanged" Content="0" IsChecked="True" /> <RadioButton x:Name="SamplingInterval10Radio" CheckedChanged="OnSamplingIntervalChanged" Content="10" /> <RadioButton x:Name="SamplingInterval20Radio" CheckedChanged="OnSamplingIntervalChanged" Content="20" /> </HorizontalStackLayout> </Grid> </ScrollView> </Border> <Label Grid.RowSpan="2" Grid.ColumnSpan="2" Margin="0,0,10,30" FontAttributes="Italic" FontSize="11" HorizontalOptions="End" Text="Raster data Copyright Scottish Government and SEPA (2014)" TextColor="White" VerticalOptions="End" /> </Grid></ContentPage>