Learn how to add features to an existing feature layer.
In this tutorial you draw graphics and use the Point and Feature classes to create trailhead features in the Santa Monica mountains. The data will be stored in your own ArcGIS Online account and can be used in other tutorials and projects.
Prerequisites
The ArcGIS API for Python tutorials use Jupyter Notebooks to execute Python code. If you are new to this environment, please see the guide to install the API and use notebooks locally.
Steps
Prepare data
You will access the Trailheads feature layer created in the Import Data tutorial. You
can also create a blank online layer using the Developers Dashboard or ArcGIS Online, see Create a new feature
layer for detailed steps.
Import modules and log in
-
Import the
GISclass from thearcgis.gismodule. Use theGISclass to Log in using your ArcGIS Online or Developer account.Use dark colors for code blocks from arcgis.gis import GIS import getpass gis = GIS( url="https://www.arcgis.com", username="username", password=getpass.getpass("Enter password:"), )
Access the feature layer
-
Use the
contentproperty to search for theTrailheadsfeature layer you created in the Import Data tutorial.Use dark colors for code blocks gis = GIS( url="https://www.arcgis.com", username="username", password=getpass.getpass("Enter password:"), ) query = f'title: Trailheads*" AND type: "Feature Service" AND owner:{gis.properties.user.username}' search_results = gis.content.search(query=query, max_items=10) search_results -
Find the
Trailheadsfeature layer from the list of results, and display the URL of the item. The index for the specific layer may be different in your organization.Use dark colors for code blocks query = f'title: Trailheads*" AND type: "Feature Service" AND owner:{gis.properties.user.username}' search_results = gis.content.search(query=query, max_items=10) search_results myPoints_item = search_results[0] myPoints_item.url -
Access the list of layers in the feature layer, and assign to a new variable named
points_.layer Use dark colors for code blocks query = f'title: Trailheads*" AND type: "Feature Service" AND owner:{gis.properties.user.username}' search_results = gis.content.search(query=query, max_items=10) search_results myPoints_item = search_results[0] myPoints_item.url feature_layers = myPoints_item.layers points_layer = feature_layers[0] points_layer.properties.name -
List the field names and field types by enumerating through the fields using the layer
properties.Use dark colors for code blocks feature_layers = myPoints_item.layers points_layer = feature_layers[0] points_layer.properties.name for field in points_layer.properties["fields"]: print(f"Name: {field['name']}, type: {field['type']}")
Create an edit function
-
Write a callback function for the map widget's
omethod. Import the features and geometry modules. You will use then_ click geometrymodule to create aPointgeometry object from the location clicked on the map. Use thefeaturesmodule to create aFeatureobject from this point to add to the feature layer. Use thedrawmethod on the map to temporarily display the new point in the map.Use dark colors for code blocks for field in points_layer.properties["fields"]: print(f"Name: {field['name']}, type: {field['type']}") from arcgis import features from arcgis import geometry import random def create_feature(_map, location): try: oid = 1 point = geometry.Point(location) feature = features.Feature( geometry=point, attributes={ "TRL_NAME": "My Trailhead", "TRL_ID": random.sample(range(-32768, 32767), 1)[0], }, ) points_layer.edit_features(adds=[feature]) _map.draw(point) except Exception as ex: print(f"could not create feature. {str(ex)}")
Create the map
-
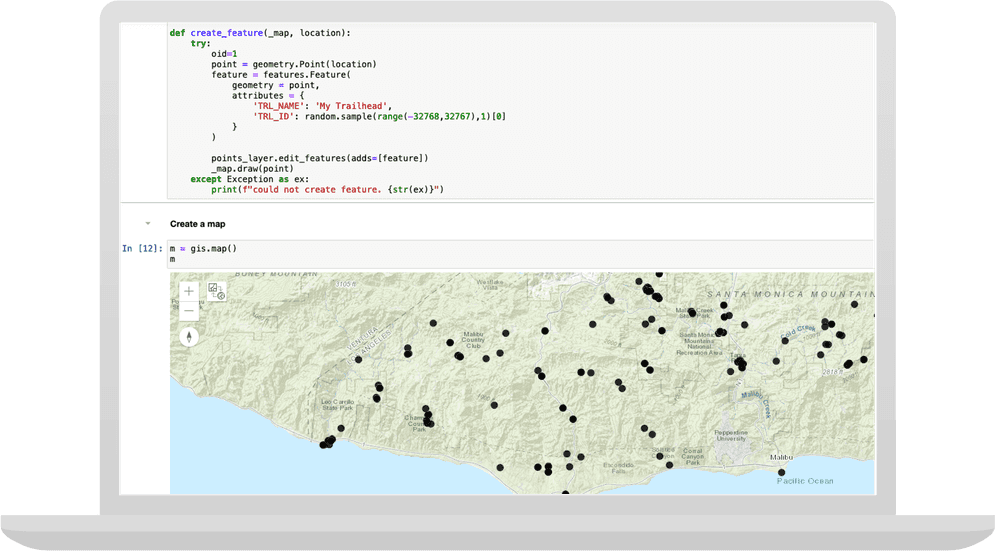
Pass the
create_function as a parameter to the map widget'sfeature omethod. Run the cell and begin clicking locations on the map. When you click at a location on the map,n_ click PointandFeatureobject are constructed. TheFeatureis rendered as a graphic marker on the map. TheFeatureis then added to feature layer through the edit process.Use dark colors for code blocks from arcgis import features from arcgis import geometry import random def create_feature(_map, location): try: oid = 1 point = geometry.Point(location) feature = features.Feature( geometry=point, attributes={ "TRL_NAME": "My Trailhead", "TRL_ID": random.sample(range(-32768, 32767), 1)[0], }, ) points_layer.edit_features(adds=[feature]) _map.draw(point) except Exception as ex: print(f"could not create feature. {str(ex)}") m = gis.map() m # wait for the map to load, and then add the following: m.center = [34.09042, -118.71511] m.zoom = 11 m.on_click(create_feature) -
Clear the map graphics. Clear the graphic markers from the map so that in the subsequent step you can add the feature layer and see the features created by clicking locations.
Use dark colors for code blocks m = gis.map() m # wait for the map to load, and then add the following: m.center = [34.09042, -118.71511] m.zoom = 11 m.on_click(create_feature) m.clear_graphics() -
Add the layer to the map to visualize features.
Use dark colors for code blocks m = gis.map() m # wait for the map to load, and then add the following: m.center = [34.09042, -118.71511] m.zoom = 11 m.on_click(create_feature) m.clear_graphics() m.add_layer(points_layer)
You should see the new feature displayed on the map.
What's next?
Learn how to use additional functionality in these tutorials: