- URL:
- https://<rasteranalysistools-url>/InterpolatePoints
- Methods:
GET- Version Introduced:
- 10.5
Description
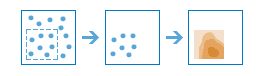
The Interpolate task predicts values at new locations based on measurements from a collection of points. The tool takes point data with values at each point and returns a raster of predicted values.
Some examples of interpolating rasters from point data include:
- An air quality management district has sensors that measure pollution levels.
Interpolatecan be used to predict pollution levels at locations that don't have sensors, such as locations with at-risk populations or hospitals.Points - Predict heavy metal concentrations in crops based on samples taken from individual plants.
- Predict soil nutrient levels (nitrogen, phosphorus, potassium, and so on) and other indicators (such as electrical conductivity) in order to study their relationships to crop yield and prescribed precise amounts of fertilizer for each location in the field.
- Meteorological applications include prediction of temperatures, rainfall, and associated variables (such as acid rain).
Request parameters
| Parameter | Details |
|---|---|
(Required) | The point layer that contains the points where the values have been measured. Syntax: This parameter can be specified as a URL to a feature service layer with an optional filter to select specific features, or a feature collection. Examples: |
(Required) | Provide the field whose values you wish to interpolate. The field must be numeric. Syntax: A string that represents a field name. The field can contain integer or float values. Example: |
(Required) |
The name of the output image service that will be created. You can specify the name, or you can create an empty service using Portal Admin Sharing API and use the return JSON object as input to this parameter. Syntax: A JSON object describes the name of the output or the output raster. Output name example: Output raster examples: |
| Choose your preference for speed versus accuracy. More accurate predictions take longer to calculate. This parameter alters the default values of several other parameters of Syntax: This parameter offers three optimization methods:
Example: |
| Choose whether to transform your data to the normal distribution. Interpolation is most accurate for data that follow a normal (bell-shaped) distribution. If your data does not appear to be normally distributed, you should perform a transformation. Syntax: A Boolean value as either
Example: |
|
Syntax: The value can range from 30-500. Example: |
| Predictions are calculated based on neighboring points. This parameter controls how many points will be used in the calculation. Using a larger number of neighbors will generally produce more accurate results, but the results take longer to calculate. Syntax: This value can range from 1 to 64, but typical values are from 5 to 15. Example: |
|
The cell size that will be used for the output raster. Supported units: The default value for this parameter is the same as the analysis environment. Example: |
| Choose whether you want to create a raster of standard errors for the predicted values. Syntax: A Boolean value as either
Example: |
|
Contains additional settings that affect task processing. This task has the following settings:
|
|
The response format. The default response format is Values: |
Response
When you submit a request, the task assigns a unique job ID for the transaction.
{
"jobId": "<unique job identifier>",
"jobStatus": "<job status>"
}After the initial request is submitted, you can use the job to periodically check the status of the job and messages as described in Checking job status. Once the job has successfully completed, you use the job to retrieve the results. To track the status, you can make a request of the following form:
https://<raster analysis tools url>/InterpolatePoints/jobs/<jobId>When the status of the job request is esri , you can access the results of the analysis by making a request of the following form:
https://<raster analysis tools url>/InterpolatePoints/jobs/<jobId>/results/<output parameter>Example usage
Below is a sample request URL for Interpolate .
https://services.myserver.com/arcgis/rest/services/System/RasterAnalysisTools/GPServer/InterpolatePoints/submitJobJSON Response syntax
The response returns the output and output output parameters, which have properties for parameter name, data type, and value. The content of value is always the output raster dataset item and the image service URL.
{
"paramName": <parameter name>,
"dataType": "GPString",
"value": {
"itemId": <item Id>,
"url": <URL>
}
}JSON Response example
{
"paramName": "outRaster",
"dataType": "GPString",
"value": {
"itemId": "f121390b85ef419790479fc75b493efd",
"url": "https://<server name>/arcgis/rest/services/Hosted/<service name>/ImageServer"
}
}