Add client side feature reduction on a point feature layer that is not pre-configured with clustering.
Use case
Feature clustering can be used to dynamically aggregate groups of points that are within proximity of each other in order to represent each group with a single symbol. Such grouping allows you to see patterns in the data that are difficult to visualize when a layer contains hundreds or thousands of points that overlap and cover each other. Users can add feature clustering to point feature layers. This is useful when the layer does not have the feature reduction defined or when the existing feature reduction properties need to be overridden.
How to use the sample
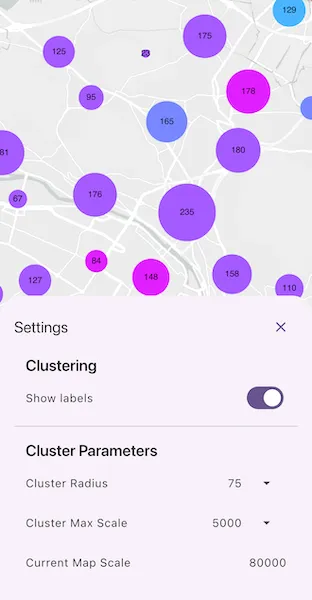
Tap the Apply Clustering button to set new feature reduction object on the feature layer. Interact with the controls to customize clustering feature reduction properties. Tap on any clustered aggregate geoelement to see the cluster feature count and aggregate fields in the popup.
How it works
- Create a map from a web map
PortalItem. - Create a
ClassBreaksRendererand define aFieldNameandDefaultSymbol.FieldNamemust be one of the summary fields in theAggregateFieldscollection. - Add
ClassBreakobjects each with an associatedSimpleMarkerSymbolto the renderer. - Create a
ClusteringFeatureReductionusing the renderer. - Add
AggregateFieldobjects to the feature reduction where theFieldNameis the name of the field to aggregate and theStatisticTypeis the type of aggregation to perform. - Define the
minSymbolSizeandmaxSymbolSizefor the feature reduction. If these are not defined they default to 12 and 70 respectively. - Add the
ClusteringFeatureReductionto theFeatureLayer. - Create a
LabelDefinitionwith aSimpleLabelExpressionandTextSymbolto define the cluster label. - Configure a
onTapevent handler on theMapViewto display feature cluster information in aPopupView.
Relevant API
- AggregateGeoElement
- ClassBreaksRenderer
- FeatureLayer
- FeatureReduction
- GeoElement
- IdentifyLayerResult
- PopupView
About the data
This sample uses a web map that displays residential data for Zurich, Switzerland.
Tags
aggregate, bin, cluster, group, merge, normalize, popup, reduce, renderer, summarize
Sample code
// Copyright 2025 Esri//// Licensed under the Apache License, Version 2.0 (the "License");// you may not use this file except in compliance with the License.// You may obtain a copy of the License at////   https://www.apache.org/licenses/LICENSE-2.0//// Unless required by applicable law or agreed to in writing, software// distributed under the License is distributed on an "AS IS" BASIS,// WITHOUT WARRANTIES OR CONDITIONS OF ANY KIND, either express or implied.// See the License for the specific language governing permissions and// limitations under the License.//
import 'package:arcgis_maps/arcgis_maps.dart';import 'package:arcgis_maps_sdk_flutter_samples/common/common.dart';import 'package:arcgis_maps_toolkit/arcgis_maps_toolkit.dart';import 'package:flutter/material.dart';
class ConfigureClusters extends StatefulWidget {  const ConfigureClusters({super.key});
  @override  State<ConfigureClusters> createState() => _ConfigureClustersState();}
class _ConfigureClustersState extends State<ConfigureClusters>    with SampleStateSupport {  // Create a controller for the map view.  final _mapViewController = ArcGISMapView.createController();
  // Create a feature layer and clustering feature reduction.  late FeatureLayer _layer;  ClusteringFeatureReduction? _featureReduction;
  // Flags for when the map view is ready and controls can be used.  var _ready = false;  var _showLabels = true;  var _settingsVisible = false;
  // Create options for configuring the radius and max display scale for clusters.  final _clusterRadiusOptions = const [30, 45, 60, 75, 90];  // Default cluster radius.  var _selectedRadius = 60;  // Options for configuring the maximum display scale for clusters (0 = unlimited).  final _clusterMaxScaleOptions = const [    0,    1000,    5000,    10000,    50000,    100000,    500000,  ];  // Default max scale (0 = unlimited).  var _selectedMaxScale = 0;
  // Snapshot of the map scale shown in the settings sheet.  var _mapScale = 0.0;
  // Define the options available for selecting a cluster radius and max display scale.  late final _radiusEntries = _clusterRadiusOptions      .map((v) => DropdownMenuEntry(value: v, label: '$v'))      .toList();
  // Dropdown menu entries for the max scale options.  late final _maxScaleEntries = _clusterMaxScaleOptions      .map((v) => DropdownMenuEntry(value: v, label: '$v'))      .toList();
  @override  Widget build(BuildContext context) {    return Scaffold(      body: Stack(        children: [          SafeArea(            top: false,            left: false,            right: false,            child: Column(              children: [                Expanded(                  // Add a map view to the widget tree and set a controller.                  child: ArcGISMapView(                    controllerProvider: () => _mapViewController,                    onMapViewReady: _onMapViewReady,                    onTap: _onMapTap,                  ),                ),                Row(                  mainAxisAlignment: MainAxisAlignment.spaceEvenly,                  children: [                    ElevatedButton(                      onPressed: () {                        final vp = _mapViewController.getCurrentViewpoint(                          ViewpointType.centerAndScale,                        );                        setState(() {                          _mapScale = vp?.targetScale ?? _mapScale;                          _settingsVisible = true;                        });                      },                      child: const Text('Clustering Settings'),                    ),                  ],                ),              ],            ),          ),          LoadingIndicator(visible: !_ready),        ],      ),      bottomSheet: _settingsVisible ? buildSettings(context) : null,    );  }
  Future<void> _onMapViewReady() async {    // Create a map using the portal item of a Zurich buildings web map.    final map = ArcGISMap.withItem(      PortalItem.withPortalAndItemId(        portal: Portal.arcGISOnline(),        itemId: 'aa44e79a4836413c89908e1afdace2ea',      ),    );
    // Add the map to the map view controller.    _mapViewController.arcGISMap = map;    // Explicitly load the web map so that we can access the operational layers.    await map.load();
    // Get the first layer from the operational layers.    _layer = map.operationalLayers.first as FeatureLayer;
    // Set initial viewpoint to Zurich.    _mapViewController.setViewpoint(      Viewpoint.withLatLongScale(        latitude: 47.38,        longitude: 8.53,        scale: 80000,      ),    );    // Set the ready state variable to true to enable the sample UI.    setState(() => _ready = true);  }
  Future<void> _applyClustering() async {    // If feature reduction already applied.    if (_featureReduction != null) return;
    // Create a class breaks renderer for "Average Building Height".    final classBreaksRenderer = ClassBreaksRenderer()      ..fieldName = 'Average Building Height';
    final colors = <Color>[      const Color.fromARGB(255, 4, 251, 255),      const Color.fromARGB(255, 44, 211, 255),      const Color.fromARGB(255, 74, 181, 255),      const Color.fromARGB(255, 120, 135, 255),      const Color.fromARGB(255, 165, 90, 255),      const Color.fromARGB(255, 194, 61, 255),      const Color.fromARGB(255, 224, 31, 255),      const Color.fromARGB(255, 254, 1, 255),    ];
    for (var i = 0; i <= 7; i++) {      classBreaksRenderer.classBreaks.add(        ClassBreak(          description: '$i',          label: '$i',          minValue: i.toDouble(),          maxValue: (i + 1).toDouble(),          symbol: SimpleMarkerSymbol(color: colors[i]),        ),      );    }
    // Define a default symbol for anything outside the 0–8 ranges.    classBreaksRenderer.defaultSymbol = SimpleMarkerSymbol(color: Colors.pink);
    // Create a clustering feature reduction with aggregates and labels.    final fr = ClusteringFeatureReduction(classBreaksRenderer)      ..enabled = true      ..aggregateFields.add(        AggregateField.withFieldName(          name: 'Total Residential Buildings',          statisticFieldName: 'Residential_Buildings',          statisticType: AggregateStatisticType.sum,        ),      )      ..aggregateFields.add(        AggregateField.withFieldName(          name: 'Average Building Height',          statisticFieldName: 'Most_common_number_of_storeys',          statisticType: AggregateStatisticType.mode,        ),      )      ..minSymbolSize = 5      ..maxSymbolSize = 90      ..radius = _selectedRadius.toDouble()      ..maxScale = _selectedMaxScale.toDouble()      ..showLabels = _showLabels;
    // Define a label expression using the cluster count.    final simpleLabelExpression = SimpleLabelExpression(      simpleExpression: '[cluster_count]',    );    // Define a label definition using the label expression and a text symbol. Position the placement of the label at the center of the feature geometry.    final textSymbol = TextSymbol(size: 12);    final labelDefinition = LabelDefinition(      labelExpression: simpleLabelExpression,      textSymbol: textSymbol,    )..placement = LabelingPlacement.pointCenterCenter;
    // Add the label definition to the feature reduction.    fr.labelDefinitions.add(labelDefinition);
    // Popup for clusters.    fr.popupDefinition = PopupDefinition.withPopupSource(fr);
    // Apply the feature reduction to the feature layer.    _layer.featureReduction = fr;    setState(() => _featureReduction = fr);  }
  Future<void> _onMapTap(Offset offset) async {    final result = await _mapViewController.identifyLayer(      _layer,      screenPoint: offset,      tolerance: 22,    );    if (result.popups.isNotEmpty) {      _showPopup(result.popups.first);      return;    }
    // Fallback: build a Popup from the top GeoElement using an available definition.    final fallback = await _mapViewController.identifyLayer(      _layer,      screenPoint: offset,      tolerance: 22,    );    if (fallback.geoElements.isNotEmpty) {      final ge = fallback.geoElements.first;      final pd = _featureReduction?.popupDefinition ?? _layer.popupDefinition;      if (pd != null) {        _showPopup(Popup(geoElement: ge, popupDefinition: pd));      }    }  }
  void _showPopup(Popup popup) {    if (!mounted) return;    showModalBottomSheet<void>(      context: context,      isScrollControlled: true,      useSafeArea: true,      builder: (_) => SizedBox(        height: MediaQuery.sizeOf(context).height * 0.5,        child: PopupView(          popup: popup,          onClose: () => Navigator.of(context).maybePop(),        ),      ),    );  }
  Widget buildSettings(BuildContext context) {    final theme = Theme.of(context);    final headingStyle = theme.textTheme.titleLarge?.copyWith(      fontWeight: FontWeight.w600,    );    final itemTextStyle = theme.textTheme.bodyLarge;
    const tilePadding = EdgeInsets.symmetric(horizontal: 16);
    return BottomSheetSettings(      onCloseIconPressed: () => setState(() => _settingsVisible = false),      settingsWidgets: (context) => [        SizedBox(          height: MediaQuery.sizeOf(context).height * 0.4,          child: ListTileTheme(            contentPadding: tilePadding,            child: ListView(              padding: const EdgeInsets.symmetric(vertical: 8),              children: [                // Clustering heading.                Padding(                  padding: const EdgeInsets.fromLTRB(16, 8, 16, 4),                  child: Text('Clustering', style: headingStyle),                ),
                // Apply clustering (switch).                Visibility(                  visible: _featureReduction == null,                  child: SwitchListTile(                    title: Text('Apply clustering', style: itemTextStyle),                    value: _featureReduction != null,                    onChanged: (on) async {                      if (on) {                        await _applyClustering();                      } else {}                    },                  ),                ),
                // Show labels (switch; only active when clustering is on).                SwitchListTile(                  title: Text('Show labels', style: itemTextStyle),                  value: _showLabels,                  onChanged: _featureReduction == null                      ? null                      : (v) {                          setState(() => _showLabels = v);                          _featureReduction?.showLabels = v;                        },                ),
                const Divider(height: 24),
                // Cluster Parameters heading.                Padding(                  padding: const EdgeInsets.fromLTRB(16, 8, 16, 4),                  child: Text('Cluster Parameters', style: headingStyle),                ),
                // Cluster Radius Dropdown menu.                ListTile(                  title: Text('Cluster Radius', style: itemTextStyle),                  trailing: DropdownMenu<int>(                    enabled: _featureReduction != null,                    textAlign: TextAlign.end,                    textStyle: itemTextStyle,                    initialSelection: _selectedRadius,                    dropdownMenuEntries: _radiusEntries,                    onSelected: _featureReduction == null                        ? null                        : (value) {                            if (value == null) return;                            setState(() => _selectedRadius = value);                            _featureReduction?.radius = value.toDouble();                            if (_featureReduction != null) {                              // Nudge refresh.                              _layer.featureReduction = _featureReduction;                            }                          },                  ),                ),
                // Cluster Max Scale Dropdown menu.                ListTile(                  title: Text('Cluster Max Scale', style: itemTextStyle),                  trailing: DropdownMenu<int>(                    enabled: _featureReduction != null,                    textStyle: itemTextStyle,                    textAlign: TextAlign.end,                    initialSelection: _selectedMaxScale,                    dropdownMenuEntries: _maxScaleEntries,                    onSelected: _featureReduction == null                        ? null                        : (value) {                            if (value == null) return;                            setState(() => _selectedMaxScale = value);                            _featureReduction?.maxScale = value.toDouble();                          },                  ),                ),
                // Current Map Scale.                ListTile(                  title: Text('Current Map Scale', style: itemTextStyle),                  trailing: Text(                    _mapScale.toStringAsFixed(0),                    style: itemTextStyle,                  ),                ),              ],            ),          ),        ),      ],    );  }}