Perform an interactive viewshed analysis to determine visible and non-visible areas from a given observer position.
Use case
A viewshed analysis calculates the visible and non-visible areas from an observer’s location, based on factors such as elevation and topographic features. For example, an interactive viewshed analysis can be used to identify which areas can be seen from a helicopter moving along a given flight path for monitoring wildfires while taking parameters such as height, field of view, and heading into account to give immediate visual feedback. A user could further extend their viewshed analysis calculations by using map algebra to e.g. only return viewshed results in geographical areas not covered in forest if they have an additional land cover raster dataset.
Note: This analysis is a form of “data-driven analysis”, which means the analysis is calculated at the resolution of the data rather than the resolution of the display.
How to use the sample
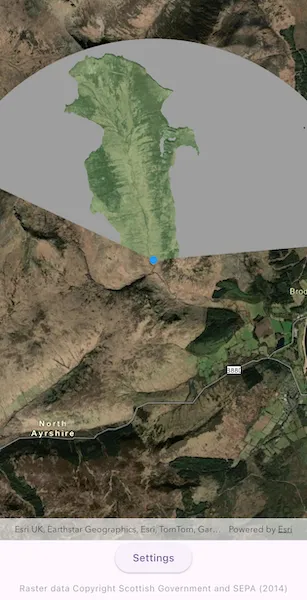
The sample loads with a viewshed analysis initialized from an elevation raster covering the Isle of Arran, Scotland. Transparent green shows the area visible from the observer position, and grey shows the non-visible areas. Move the observer position by long-pressing and dragging over the island to interactively evaluate the viewshed result and display it in the analysis overlay. Alternatively, tap on the map to see the viewshed from the tapped location. Use the Settings sheet to explore how the viewshed analysis results change when adjusting the observer elevation, target height, maximum radius, field of view, heading and elevation sampling interval. As you move the observer and update the viewshed parameters, the analysis overlay refreshes to show the evaluated viewshed result.
How it works
- Create an
ArcGISMapand set it on anArcGISMapView. - Add a
GraphicsOverlayto draw the observer point and anAnalysisOverlayto the map view. - Create a
ContinuousFieldfrom a raster file containing elevation data. - Create and configure
ViewshedParameters, passing in anArcGISPointas the observer position for the viewshed. - Create a
ContinuousFieldFunctionfrom the continuous field. - Create a
ViewshedFunctionusing the continuous field function and viewshed parameters, then convert it to aDiscreteFieldFunction. - Create a
ColormapRendererfrom aColormapwith colors that represent visible and non-visible results. - Create a
FieldAnalysisfrom the discrete field function and colormap renderer, then add it to theAnalysisOverlay’s collection of analysis objects to display the results. As parameter values change, the result is recalculated and redrawn automatically.
Relevant API
- AnalysisOverlay
- Colormap
- ColormapRenderer
- ContinuousField
- ContinuousFieldFunction
- FieldAnalysis
- ViewshedFunction
- ViewshedParameters
About the data
The sample uses a 10m resolution digital terrain elevation raster of the Isle of Arran, Scotland (Data Copyright Scottish Government and SEPA (2014)).
Tags
analysis overlay, elevation, field analysis, interactive, raster, spatial analysis, terrain, viewshed, visibility
Sample code
// Copyright 2026 Esri//// Licensed under the Apache License, Version 2.0 (the "License");// you may not use this file except in compliance with the License.// You may obtain a copy of the License at////   https://www.apache.org/licenses/LICENSE-2.0//// Unless required by applicable law or agreed to in writing, software// distributed under the License is distributed on an "AS IS" BASIS,// WITHOUT WARRANTIES OR CONDITIONS OF ANY KIND, either express or implied.// See the License for the specific language governing permissions and// limitations under the License.//
import 'dart:io';
import 'package:arcgis_maps/arcgis_maps.dart';import 'package:arcgis_maps_sdk_flutter_samples/common/common.dart';import 'package:flutter/material.dart';import 'package:go_router/go_router.dart';
class ShowInteractiveViewshedWithAnalysisOverlay extends StatefulWidget {  const ShowInteractiveViewshedWithAnalysisOverlay({super.key});
  @override  State<ShowInteractiveViewshedWithAnalysisOverlay> createState() =>      _ShowInteractiveViewshedWithAnalysisOverlayState();}
class _ShowInteractiveViewshedWithAnalysisOverlayState    extends State<ShowInteractiveViewshedWithAnalysisOverlay>    with SampleStateSupport {  // The elevation file used in the analysis.  late File _elevationFile;
  // Create a controller for the map view.  final _mapViewController = ArcGISMapView.createController();
  // Set the initial observer position on the Isle of Arran, Scotland.  var _observerPosition = ArcGISPoint(    x: -579246.504,    y: 7479619.947,    z: 20,    spatialReference: SpatialReference.webMercator,  );
  // A graphic to represent the observer position on the map.  final _observerGraphic = Graphic(    symbol: SimpleMarkerSymbol(color: Colors.blue, size: 10),  );
  // The parameters for the viewshed analysis.  late final ViewshedParameters _viewshedParameters;
  // The screen point of the observer when a long-press gesture starts (null when not moving).  Offset? _moveStartScreenPoint;
  // A flag for when the settings bottom sheet is visible.  var _settingsVisible = false;
  // A flag for when the map view is ready and controls can be used.  var _ready = false;
  @override  void initState() {    // Get the elevation data used in the sample.    final listPaths = GoRouter.of(context).state.extra! as List<String>;    _elevationFile = File(listPaths.first);
    super.initState();  }
  @override  Widget build(BuildContext context) {    return Scaffold(      body: SafeArea(        top: false,        left: false,        right: false,        child: Stack(          children: [            Column(              children: [                Expanded(                  child: Stack(                    children: [                      // Add a map view to the widget tree and set a controller.                      ArcGISMapView(                        controllerProvider: () => _mapViewController,                        onMapViewReady: onMapViewReady,                        onTap: onTap,                      ),                      // Add a detector to handle long-press gestures for moving the observer position.                      GestureDetector(                        onLongPressStart: onLongPressStart,                        onLongPressMoveUpdate: onLongPressMoveUpdate,                        onLongPressEnd: onLongPressEnd,                      ),                    ],                  ),                ),                Row(                  mainAxisAlignment: MainAxisAlignment.spaceEvenly,                  children: [                    // A button to show the Settings bottom sheet.                    ElevatedButton(                      onPressed: () => setState(() => _settingsVisible = true),                      child: const Text('Settings'),                    ),                  ],                ),                const SizedBox(height: 10),                Text(                  'Raster data Copyright Scottish Government and SEPA (2014)',                  style: Theme.of(                    context,                  ).textTheme.bodySmall?.copyWith(color: Colors.grey),                ),              ],            ),            // Display a progress indicator and prevent interaction until state is ready.            LoadingIndicator(visible: !_ready),          ],        ),      ),      bottomSheet: _settingsVisible ? buildSettings(context) : null,    );  }
  Future<void> onMapViewReady() async {    // Create a map with the imagery style.    final map = ArcGISMap.withBasemapStyle(BasemapStyle.arcGISImagery);    _mapViewController.arcGISMap = map;
    // Set an initial viewpoint centered over the observer position.    map.initialViewpoint = Viewpoint.fromCenter(      _observerPosition,      scale: 100000,    );
    // Add the graphic for the observer position.    final graphicsOverlay = GraphicsOverlay();    graphicsOverlay.graphics.add(_observerGraphic);    _mapViewController.graphicsOverlays.add(graphicsOverlay);
    // Create the continuous field from the elevation file.    final continuousField = await ContinuousField.createFromFiles(      filePaths: [_elevationFile.uri],      band: 0,    );
    // Create the continuous field function for the viewshed analysis from the continuous field.    final continuousFieldFunction = ContinuousFieldFunction.create(      continuousField,    );
    // Initialize the viewshed parameters.    _viewshedParameters = ViewshedParameters()      ..targetHeight = 20.0      ..maxRadius = 8000      ..fieldOfView = 150      ..heading = 10;
    // Create the viewshed function with the continuous field function and parameters.    final viewshedFunction = ViewshedFunction.withContinuousFieldFunction(      elevation: continuousFieldFunction,      parameters: _viewshedParameters,    );
    // Convert the viewshed function to a discrete field function.    final discreteViewshed = viewshedFunction.toDiscreteFieldFunction();
    // Create colormap renderer for displaying the viewshed result.    final colormap = Colormap([      Colors.grey,      const Color.fromRGBO(136, 204, 132, 0.371), // translucent green    ]);    final colormapRenderer = ColormapRenderer.withColormap(colormap);
    // Create the field analysis with the discrete viewshed function and renderer.    final analysis = FieldAnalysis.withDiscreteFieldFunction(      function: discreteViewshed,      renderer: colormapRenderer,    );
    // Create an analysis overlay and add the analysis to it.    final analysisOverlay = AnalysisOverlay();    analysisOverlay.analyses.add(analysis);    _mapViewController.analysisOverlays.add(analysisOverlay);
    // Synchronize the viewshed parameters and graphic to the initial observer position.    syncObserverPosition();
    // Set the ready state variable to true to enable the sample UI.    setState(() => _ready = true);  }
  void syncObserverPosition() {    // Update the observer graphic geometry to the current observer position.    _observerGraphic.geometry = _observerPosition;
    // Update the viewshed parameters to the current observer position, which triggers analysis.    _viewshedParameters.observerPosition = _observerPosition;  }
  void onTap(Offset screenPoint) {    // Find the map position corresponding to the tapped screen point.    final mapPosition = _mapViewController.screenToLocation(      screen: screenPoint,    );    if (mapPosition == null) return;
    // Update the observer position to the tapped location.    _observerPosition = ArcGISPoint(      x: mapPosition.x,      y: mapPosition.y,      z: _observerPosition.z,      spatialReference: _observerPosition.spatialReference,    );    syncObserverPosition();  }
  void onLongPressStart(LongPressStartDetails details) {    // Store the screen point of the observer when the long-press gesture starts.    _moveStartScreenPoint = _mapViewController.locationToScreen(      mapPoint: _observerPosition,    );
    // Change the observer graphic color to indicate it is being moved.    (_observerGraphic.symbol as SimpleMarkerSymbol?)?.color = Colors.yellow;  }
  void onLongPressMoveUpdate(LongPressMoveUpdateDetails details) {    if (_moveStartScreenPoint == null) return;
    // Calculate the new screen point by adding the gesture movement to the stored screen point.    final newScreenPoint =        _moveStartScreenPoint! + details.localOffsetFromOrigin;
    // Convert the screen point to a map point for the new observer position.    final newObserverPosition = _mapViewController.screenToLocation(      screen: newScreenPoint,    );    if (newObserverPosition == null) return;
    // Update to the new observer position.    _observerPosition = ArcGISPoint(      x: newObserverPosition.x,      y: newObserverPosition.y,      z: _observerPosition.z,      spatialReference: _observerPosition.spatialReference,    );    syncObserverPosition();  }
  void onLongPressEnd(LongPressEndDetails details) {    // Change the observer graphic color back to indicate it is no longer being moved.    (_observerGraphic.symbol as SimpleMarkerSymbol?)?.color = Colors.blue;
    // Clear the stored screen point when the long-press gesture ends.    _moveStartScreenPoint = null;  }
  // The build method for the Settings bottom sheet.  Widget buildSettings(BuildContext context) {    return BottomSheetSettings(      onCloseIconPressed: () => setState(() => _settingsVisible = false),      settingsWidgets: (context) => [        SizedBox(          height: MediaQuery.sizeOf(context).height * 0.5,          child: ListView(            children: [              // Display and edit the observer elevation with a slider.              Text(                'Observer elevation: ${_observerPosition.z?.toStringAsFixed(0)} m',              ),              Slider(                value: _observerPosition.z ?? 20,                min: 2,                max: 200,                onChanged: (value) {                  setState(                    () => _observerPosition = ArcGISPoint(                      x: _observerPosition.x,                      y: _observerPosition.y,                      z: value,                      spatialReference: _observerPosition.spatialReference,                    ),                  );                  syncObserverPosition();                },              ),              // Display and edit the viewshed target height with a slider.              Text(                'Target height: ${_viewshedParameters.targetHeight.toStringAsFixed(0)} m',              ),              Slider(                value: _viewshedParameters.targetHeight,                min: 2,                max: 1000,                onChanged: (value) {                  setState(() => _viewshedParameters.targetHeight = value);                },              ),              // Display and edit the viewshed maximum radius with a slider.              Text(                'Maximum radius: ${_viewshedParameters.maxRadius.toStringAsFixed(0)} m',              ),              Slider(                value: _viewshedParameters.maxRadius,                min: 250,                max: 20000,                onChanged: (value) {                  setState(() => _viewshedParameters.maxRadius = value);                },              ),              // Display and edit the viewshed field of view with a slider.              Text(                'Field of view: ${_viewshedParameters.fieldOfView.toStringAsFixed(0)}°',              ),              Slider(                value: _viewshedParameters.fieldOfView,                min: 5,                max: 360,                onChanged: (value) {                  setState(() => _viewshedParameters.fieldOfView = value);                },              ),              // Display and edit the viewshed heading with a slider.              Text(                'Heading: ${_viewshedParameters.heading.toStringAsFixed(0)}°',              ),              Slider(                value: _viewshedParameters.heading,                max: 360,                onChanged: (value) {                  setState(() => _viewshedParameters.heading = value);                },              ),              // Display and edit the viewshed elevation sampling interval with radio buttons.              const Text('Elevation sampling interval:'),              RadioGroup(                groupValue: _viewshedParameters.elevationSamplingInterval,                onChanged: (value) {                  setState(                    () =>                        _viewshedParameters.elevationSamplingInterval = value!,                  );                },                child: const Row(                  children: [                    Radio<double>(value: 0),                    Text('0 m'),                    SizedBox(width: 10),                    Radio<double>(value: 10),                    Text('10 m'),                    SizedBox(width: 10),                    Radio<double>(value: 20),                    Text('20 m'),                  ],                ),              ),            ],          ),        ),      ],    );  }}