Use a symbol style to display a graphic on a graphics overlay.
Use case
Allows you to customize a graphic by assigning a unique symbol. For example, you may wish to display individual graphics for different landmarks across a region, and to style each one with a unique symbol.
How to use the sample
Pan and zoom around the map. Observe the graphics on the map.
How it works
- Create a
GraphicsOverlayand add it to theMapView. - Create a
Symbolsuch asSimpleMarkerSymbol,SimpleLineSymbol,SimpleFillSymbolorTextSymbol. - Create a
Graphic, specifying aGeometryand a symbol. - Add the graphic to the graphics overlay.
Relevant API
- Geometry
- Graphic
- GraphicsOverlay
- SimpleFillSymbol
- SimpleLineSymbol
- SimpleMarkerSymbol
- TextSymbol
Additional information
To set a symbol style across a number of graphics (e.g. showing trees as graphics sharing a symbol in a park), see the “Add graphics with renderer” sample.
Tags
display, fill, graphics, line, marker, overlay, point, symbol
Sample code
AddGraphicsWithSymbolsSample.java
/* * Copyright 2017 Esri. * * Licensed under the Apache License, Version 2.0 (the "License"); you may not * use this file except in compliance with the License. You may obtain a copy of * the License at * * http://www.apache.org/licenses/LICENSE-2.0 * * Unless required by applicable law or agreed to in writing, software * distributed under the License is distributed on an "AS IS" BASIS, WITHOUT * WARRANTIES OR CONDITIONS OF ANY KIND, either express or implied. See the * License for the specific language governing permissions and limitations under * the License. */
package com.esri.samples.add_graphics_with_symbols;
import javafx.application.Application;import javafx.scene.Scene;import javafx.scene.layout.StackPane;import javafx.scene.paint.Color;import javafx.stage.Stage;
import com.esri.arcgisruntime.ArcGISRuntimeEnvironment;import com.esri.arcgisruntime.geometry.Point;import com.esri.arcgisruntime.geometry.PointCollection;import com.esri.arcgisruntime.geometry.Polygon;import com.esri.arcgisruntime.geometry.Polyline;import com.esri.arcgisruntime.geometry.SpatialReference;import com.esri.arcgisruntime.geometry.SpatialReferences;import com.esri.arcgisruntime.mapping.ArcGISMap;import com.esri.arcgisruntime.mapping.BasemapStyle;import com.esri.arcgisruntime.mapping.Viewpoint;import com.esri.arcgisruntime.mapping.view.Graphic;import com.esri.arcgisruntime.mapping.view.GraphicsOverlay;import com.esri.arcgisruntime.mapping.view.MapView;import com.esri.arcgisruntime.symbology.SimpleFillSymbol;import com.esri.arcgisruntime.symbology.SimpleLineSymbol;import com.esri.arcgisruntime.symbology.SimpleMarkerSymbol;import com.esri.arcgisruntime.symbology.TextSymbol;import com.esri.arcgisruntime.symbology.TextSymbol.HorizontalAlignment;import com.esri.arcgisruntime.symbology.TextSymbol.VerticalAlignment;
public class AddGraphicsWithSymbolsSample extends Application {
private MapView mapView; private GraphicsOverlay graphicsOverlay;
private static final SpatialReference SPATIAL_REFERENCE = SpatialReferences.getWgs84();
@Override public void start(Stage stage) {
try { // create stack pane and application scene StackPane stackPane = new StackPane(); Scene scene = new Scene(stackPane);
// set title, size, and add scene to stage stage.setTitle("Add Graphics with Symbols Sample"); stage.setWidth(800); stage.setHeight(700); stage.setScene(scene); stage.show();
// authentication with an API key or named user is required to access basemaps and other location services String yourAPIKey = System.getProperty("apiKey"); ArcGISRuntimeEnvironment.setApiKey(yourAPIKey);
// create a map with the oceans basemap style final ArcGISMap map = new ArcGISMap(BasemapStyle.ARCGIS_OCEANS);
// create a map view and set the map to it mapView = new MapView(); mapView.setMap(map);
// set a viewpoint on the map view mapView.setViewpoint(new Viewpoint(56.075844, -2.681572, 72223));
// create the graphics overlay graphicsOverlay = new GraphicsOverlay();
// add the graphic overlay to the map view mapView.getGraphicsOverlays().add(graphicsOverlay);
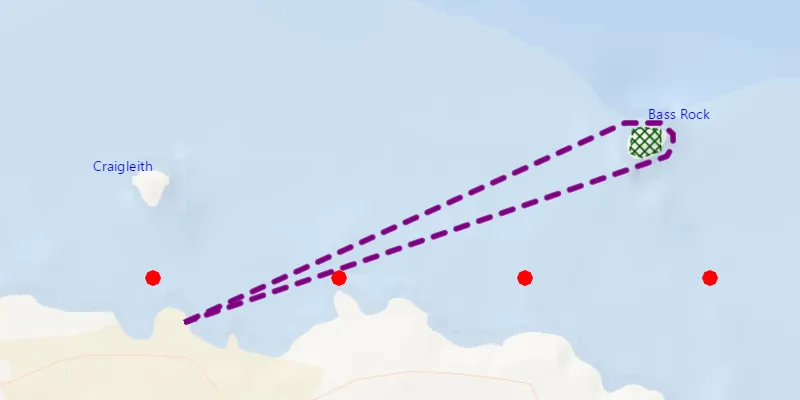
// add some red circled points to the graphics overlay createPoints();
// add the purple polyline to the graphics overlay createPolyline();
// add the green polygon mesh to the graphics overlay createPolygon();
// add the blue text symbols to the graphics overlay createText();
// add the map view to stack pane stackPane.getChildren().add(mapView); } catch (Exception e) { e.printStackTrace(); } }
/** * Creates four Points using a SimpleMarkerSymbol and adds them to a * GraphicsOverlay. */ private void createPoints() {
// create a red circle simple marker symbol SimpleMarkerSymbol redCircleSymbol = new SimpleMarkerSymbol(SimpleMarkerSymbol.Style.CIRCLE, Color.RED, 10);
// create graphics and add to graphics overlay Graphic graphic; graphic = new Graphic(new Point(-2.72, 56.065, SPATIAL_REFERENCE), redCircleSymbol); graphicsOverlay.getGraphics().add(graphic);
graphic = new Graphic(new Point(-2.69, 56.065, SPATIAL_REFERENCE), redCircleSymbol); graphicsOverlay.getGraphics().add(graphic);
graphic = new Graphic(new Point(-2.66, 56.065, SPATIAL_REFERENCE), redCircleSymbol); graphicsOverlay.getGraphics().add(graphic);
graphic = new Graphic(new Point(-2.63, 56.065, SPATIAL_REFERENCE), redCircleSymbol); graphicsOverlay.getGraphics().add(graphic); }
/** * Creates a Polyline and adds it to a GraphicsOverlay. */ private void createPolyline() {
// create a dark blue simple line symbol SimpleLineSymbol lineSymbol = new SimpleLineSymbol(SimpleLineSymbol.Style.DASH, Color.DARKBLUE, 4);
// create a new point collection for polyline PointCollection points = new PointCollection(SPATIAL_REFERENCE);
// create and add points to the point collection points.add(new Point(-2.715, 56.061)); points.add(new Point(-2.6438, 56.079)); points.add(new Point(-2.638, 56.079)); points.add(new Point(-2.636, 56.078)); points.add(new Point(-2.636, 56.077)); points.add(new Point(-2.637, 56.076)); points.add(new Point(-2.715, 56.061));
// create the polyline from the point collection Polyline polyline = new Polyline(points);
// create the graphic with polyline and symbol Graphic graphic = new Graphic(polyline, lineSymbol);
// add graphic to the graphics overlay graphicsOverlay.getGraphics().add(graphic); }
/** * Creates a Polygon and adds it to a GraphicsOverlay. */ private void createPolygon() {
// create a green simple line symbol SimpleLineSymbol outlineSymbol = new SimpleLineSymbol(SimpleLineSymbol.Style.DASH, Color.DARKGREEN, 1); // create a green mesh simple fill symbol SimpleFillSymbol fillSymbol = new SimpleFillSymbol(SimpleFillSymbol.Style.DIAGONAL_CROSS, Color.DARKGREEN, outlineSymbol);
// create a new point collection for polygon PointCollection points = new PointCollection(SPATIAL_REFERENCE);
// create and add points to the point collection points.add(new Point(-2.6425, 56.0784)); points.add(new Point(-2.6430, 56.0763)); points.add(new Point(-2.6410, 56.0759)); points.add(new Point(-2.6380, 56.0765)); points.add(new Point(-2.6380, 56.0784)); points.add(new Point(-2.6410, 56.0786));
// create the polyline from the point collection Polygon polygon = new Polygon(points);
// create the graphic with polyline and symbol Graphic graphic = new Graphic(polygon, fillSymbol);
// add graphic to the graphics overlay graphicsOverlay.getGraphics().add(graphic); }
/** * Creates two TextSymbols and adds them to a GraphicsOverlay. */ private void createText() {
// create two text symbols TextSymbol bassRockTextSymbol = new TextSymbol(10, "Bass Rock", Color.BLUE, HorizontalAlignment.LEFT, VerticalAlignment.BOTTOM);
TextSymbol craigleithTextSymbol = new TextSymbol(10, "Craigleith", Color.BLUE, HorizontalAlignment.RIGHT, VerticalAlignment.TOP);
// create two points Point bassPoint = new Point(-2.64, 56.079, SPATIAL_REFERENCE); Point craigleithPoint = new Point(-2.72, 56.076, SPATIAL_REFERENCE);
// create two graphics from the points and symbols Graphic bassRockGraphic = new Graphic(bassPoint, bassRockTextSymbol); Graphic craigleithGraphic = new Graphic(craigleithPoint, craigleithTextSymbol);
// add graphics to the graphics overlay graphicsOverlay.getGraphics().add(bassRockGraphic); graphicsOverlay.getGraphics().add(craigleithGraphic); }
/** * Stops and releases all resources used in application. */ @Override public void stop() {
if (mapView != null) { mapView.dispose(); } }
/** * Opens and runs application. * * @param args arguments passed to this application */ public static void main(String[] args) {
Application.launch(args); }
}