A symbol
A renderer
Some layer types don’t support symbols
Symbols
For features
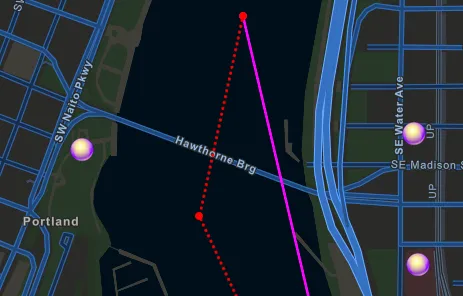
The following symbols
-
Simple symbols follow the web map specification. You can create these using the simple symbology API, or get them from web maps and feature services when advanced symbology is turned off.
-
Advanced symbols follow the ArcGIS Pro symbol model. You can create these using the multilayer symbol classes, or get them from feature services, mobile style files, dictionary renderers, and mobile map packages.
When authoring maps in ArcGIS Pro
You should use advanced symbols
A SimpleFillSymbol that uses a SimpleLineSymbol to define its outline:
// Create a blue circle symbol.SimpleMarkerSymbol markerSymbol =    new SimpleMarkerSymbol(SimpleMarkerSymbol.Style.CIRCLE, Color.BLUE, 10);
// Create a white line symbol.SimpleLineSymbol lineSymbol =    new SimpleLineSymbol(SimpleLineSymbol.Style.SOLID, Color.WHITE, 0.5f);
// Set the blue circle outline to a white line.markerSymbol.setOutline(lineSymbol);
A SimpleMarkerSceneSymbol used to define a 3D symbol for display in a ArcGISScene:
// Create a yellow cone scene symbol.SimpleMarkerSceneSymbol markerSceneSymbol = new SimpleMarkerSceneSymbol( SimpleMarkerSceneSymbol.Style.CONE, Color.YELLOW, 15, 15, 15, SceneSymbol.AnchorPosition.BOTTOM );Renderers
A renderer
Renderers are always used to symbolize feature or raster layers, since symbols cannot be applied directly to that data. A renderer
Renderers
The following are the types of renderers available for feature layers and graphics overlays:
- Simple — A simple renderer
A simple renderer is a renderer that defines a single symbol used to display all features in a layer. displays all features in a layer or graphics overlayA graphics overlay is a client-side, temporary container of graphics to display on a map view or scene view. using the same symbol. For example, display all points in the world cities layer as a small red square. - Unique value — Applies a unique symbol for each specified value of an attribute (or combination of attributes). A unique value renderer
A unique value renderer is a renderer that defines a distinct symbol for each unique data value returned from a field or expression in a layer. can be based on any data type but is typically used with string attributes. For example, display points in the world cities layer using two symbols: a small gray triangle for features with a value ofNfor theCAPITALattribute and a large yellow star for those with a value ofY. - Class breaks — Symbolizes features or graphics according to specific ranges of values for an attribute. The attribute used for a class breaks renderer
A class breaks renderer is a renderer that classifies numeric data into two or more ranges of values to create a visualization. Each class (or range) is defined by a lower and an upper value and a unique symbol. must be numeric. For example, display world cityPOPULATIONvalue with three different symbols based on size range: a small blue circle for cities with a value between0and100000, a slightly larger blue circle for cities with a value between100001and2999999, and a larger blue circle for cities with a value over3000000. - Dictionary — Renders features or graphics by constructing multilayer symbols from a style file
A style file is a and associated attribute values. A dictionary renderer.stylxfile created in ArcGIS Pro that contains symbol primitives, such as the symbol frame, lines that make up inner icons.A dictionary renderer is a renderer that uses a style file generated in ArcGIS Pro from a rule engine and is used to display types of advanced symbology on a map, such as military symbology. is commonly used to display military symbology. See the Display symbols with a dictionary renderer topic for details.
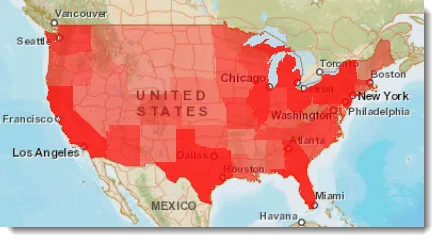
The following image shows a layer with a class breaks renderer. The renderer displays features as five classes of population, each with a different symbol (a darker or lighter shade of red).
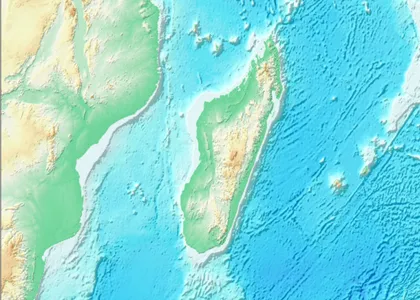
The following raster renderers are available to control how raster
- Hillshade — Creates a grayscale 3D representation of an elevation surface, with the sun’s (hypothetical) position taken into account for shading the image. It can be applied to a raster layer
A raster layer is a layer type that allows developers to display raster data in their applications. created with single-band rasterA raster is a matrix of cells (or pixels) organized into rows and columns (or a grid) where each cell contains a value representing information, such as temperature. Rasters include digital aerial photographs, imagery from satellites, digital pictures, and scanned maps. data. - Blend — Blends a hillshade
A hillshade is a layer data source with raster images that portrays hypothetical illumination of a surface by determining illumination values for each cell in a raster. image (derived from the rasterA raster is a matrix of cells (or pixels) organized into rows and columns (or a grid) where each cell contains a value representing information, such as temperature. Rasters include digital aerial photographs, imagery from satellites, digital pictures, and scanned maps. ) with the original raster. This provides a look similar to the original raster but with some terrain shading, for a rich, textured look. - Colormap — Provides a discrete mapping of raster
A raster is a matrix of cells (or pixels) organized into rows and columns (or a grid) where each cell contains a value representing information, such as temperature. Rasters include digital aerial photographs, imagery from satellites, digital pictures, and scanned maps. pixel values to colors. All pixels matching the specified value are rendered using the mapped color. This can be useful for tasks such as land classification. - Stretch — Displays continuous raster
A raster is a matrix of cells (or pixels) organized into rows and columns (or a grid) where each cell contains a value representing information, such as temperature. Rasters include digital aerial photographs, imagery from satellites, digital pictures, and scanned maps. cell values across a gradual ramp of colors. Use the stretch renderer to draw a single band of continuous data. The stretch renderer works well when you have a large range of values to display, such as in imagery, aerial photographs, or elevation models. - RGB — Uses the same methods as the stretch renderer but allows you to combine bands as red, green, and blue composites.
A SimpleRenderer that uses a SimpleMarkerSymbol for displaying all features. This renderer could be applied to a FeatureLayer or GraphicsOverlay:
// Create a cyan circle symbol.SimpleMarkerSymbol symbol =    new SimpleMarkerSymbol(SimpleMarkerSymbol.Style.CIRCLE, Color.CYAN, 4);
// Create a new renderer using the cyan circle symbol.SimpleRenderer renderer = new SimpleRenderer(symbol);
Styles
Some layers that do not support symbols and renderers, such as ArcGIS vector tile layers
ArcGIS vector tile layer styles
An ArcGIS vector tile layer
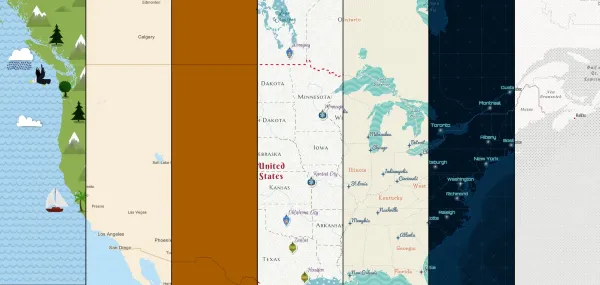
You can create your own style with the ArcGIS Vector Tile Style Editor. Your customized vector layers can then be saved to and read from ArcGIS Online.
WMS styles
WMS
The styles defined in the layer information can be inspected to determine the styles (if any) that are available. The style of a WMS