A comprehensive API is provided for visualizing geographic data in a map
Your app can:
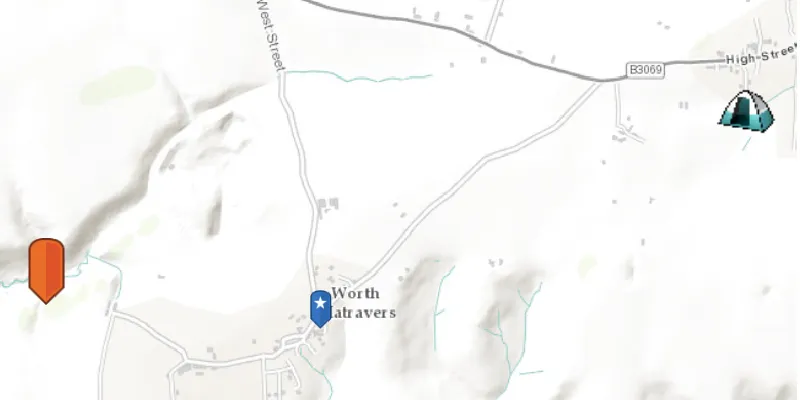
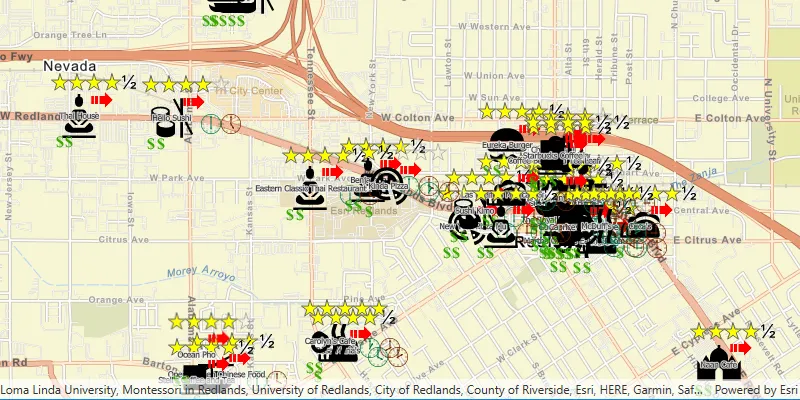
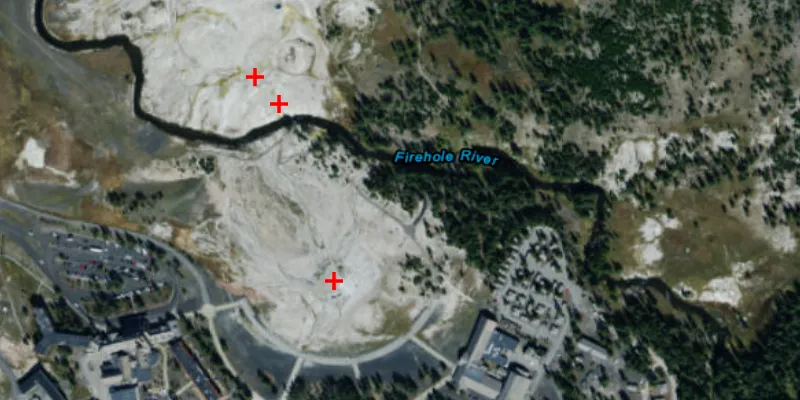
- Symbolize features
A feature is a single record, also known as a row, that represents a real-world entity. It typically contains a geometry (point, multipoint, polyline, or polygon) and attributes but it can also contain just attributes. and graphicsA graphic is a visual element composed of a geometry, symbol, and attributes that is displayed on a map or scene. . - Visualize data in 3D.
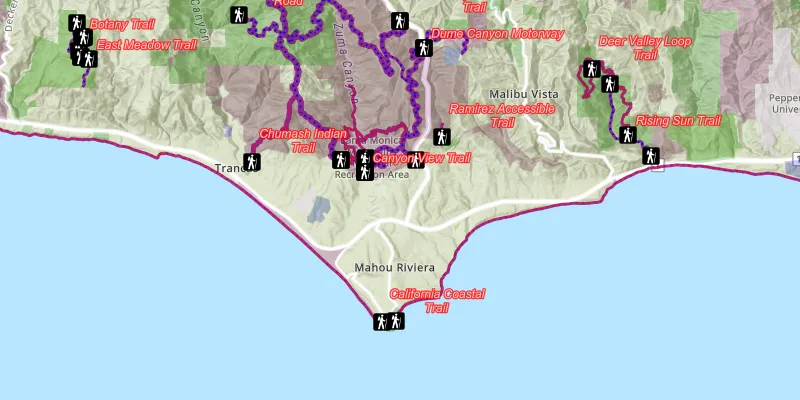
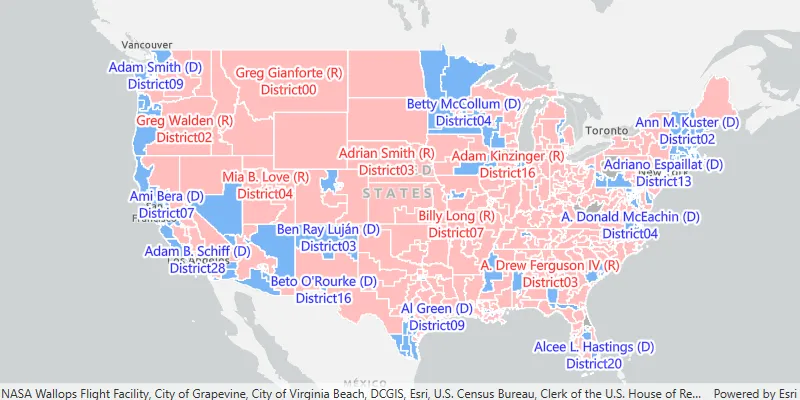
- Display labels
A label is text displayed with and associated with a graphic or feature. while controlling positioning, overlaps, and conflicts. - Render data according to attribute
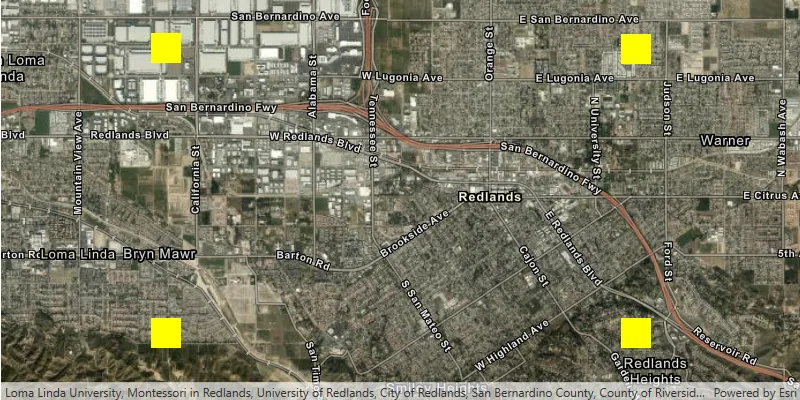
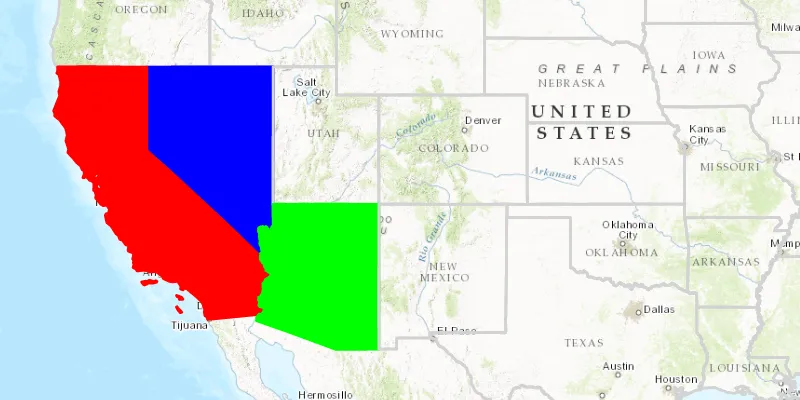
Attributes are fields and values for a single feature or non-spatial record. They are typically stored in a database or service such as a feature service. values. - Display different data and symbols at different scales.
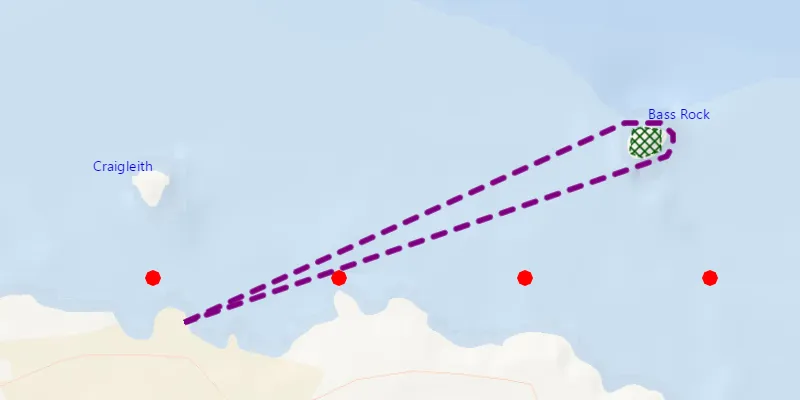
- Use a dictionary renderer
A dictionary renderer is a renderer that uses a style file generated in ArcGIS Pro from a rule engine and is used to display types of advanced symbology on a map, such as military symbology. to symbolize many unique combinations of attribute values.
Features and graphics
Features
See the Features and graphics topic for more information about when to use each of these geoelements
To learn about adding graphics to your geoview
3D display
To take full advantage of the 3D environment, features
The Render features and graphics in 3D topic describes considerations that are specific to displaying data in 3D.
Symbols
Your app can load maps
You can also create your own symbols and control the display of features and graphics in your app. See the Symbols, renderers, and styles topic for information about symbolizing data.
Renderers
A renderer
When symbolizing geoelements
See the Symbols, renderers, and styles topic for an overview of the available renderers. Display symbols with a dictionary renderer describes how to create and apply a dictionary renderer to a layer.
Labels
Feature layers
See Add labels for more information.
Tutorials
Samples
Add graphics with symbols
Add graphics renderer
Custom dictionary style
Show labels on layer
Unique value renderer
Simple renderer
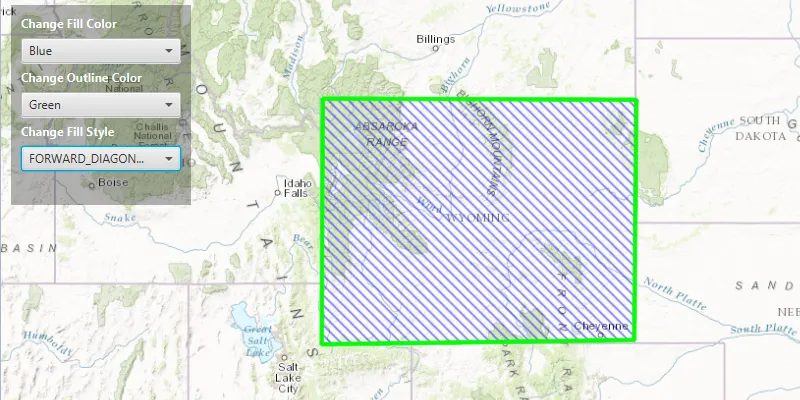
Simple fill symbol