<meta name="viewport" content="width=device-width, initial-scale=1, shrink-to-fit=no" />
<title>Query statistics client-side by distance | Sample | ArcGIS Maps SDK for JavaScript</title>
<!-- Load the Chart.js library -->
<script src="https://cdnjs.cloudflare.com/ajax/libs/Chart.js/2.4.0/Chart.min.js"></script>
<link rel="stylesheet" href="https://js.arcgis.com/5.1/esri/themes/light/main.css" />
<!-- Load the ArcGIS Maps SDK for JavaScript from CDN -->
<script type="module" src="https://js.arcgis.com/5.1/"></script>
const [MapView, WebMap, Legend, Expand, Bookmarks, lang, promiseUtils, reactiveUtils] = await $arcgis.import([
"@arcgis/core/views/MapView.js",
"@arcgis/core/WebMap.js",
"@arcgis/core/widgets/Legend.js",
"@arcgis/core/widgets/Expand.js",
"@arcgis/core/widgets/Bookmarks.js",
"@arcgis/core/core/lang.js",
"@arcgis/core/core/promiseUtils.js",
"@arcgis/core/core/reactiveUtils.js",
// declare chart variables to update as the under interacts with the sample
let yearChart, ageChart, dispositionChart, genderChart, raceChart, totalNumber, avgAge, avgOpenTime;
// load a web map containing homicide statistics
const webmap = new WebMap({
id: "96cf806c32874026bef5f586315f098c",
const view = new MapView({
// Add UI elements to the view
// Displays instructions to the user for understanding the sample
// And places them in an Expand widget instance
const titleContent = document.createElement("div");
titleContent.style.padding = "15px";
titleContent.style.backgroundColor = "white";
titleContent.style.width = "350px";
titleContent.innerHTML = [
"<div id='title' class='esri-widget'>",
"<span id='num-homicides'>0</span> homicides occurred within one mile of the pointer location over the last 10 years.",
"The average age of the victims is <span id='avg-age'>0</span>. The average time an unsolved case has been",
"open is <span id='avg-open-time'>0</span> years.",
const titleExpand = new Expand({
expandTooltip: "Summary stats",
expanded: view.widthBreakpoint !== "xsmall",
view.ui.add(titleExpand, "top-right");
const legendExpand = new Expand({
expanded: view.widthBreakpoint !== "xsmall",
view.ui.add(legendExpand, "bottom-left");
() => view.widthBreakpoint,
titleExpand.expanded = widthBreakpoint !== "xsmall";
legendExpand.expanded = widthBreakpoint !== "xsmall";
const bookmarksWidget = new Bookmarks({
const bookmarksExpand = new Expand({
content: bookmarksWidget,
view.ui.add(bookmarksExpand, "top-right");
bookmarksWidget.on("select-bookmark", (event) => {
bookmarksExpand.expanded = false;
// Displays instructions to the user for understanding the sample
// And places them in an Expand widget instance
const sampleInstructions = document.createElement("div");
sampleInstructions.style.padding = "10px";
sampleInstructions.style.backgroundColor = "white";
sampleInstructions.style.width = "300px";
sampleInstructions.innerHTML = [
"<b>Drag</b> the pointer over the data to view stats",
"within one mile of the pointer location.",
const instructionsExpand = new Expand({
expandTooltip: "How to use this sample",
content: sampleInstructions,
view.ui.add(instructionsExpand, "top-left");
let highlightHandle = null;
* Create charts and start querying the layer view when
* the view is ready and data begins to draw in the view
// Create the charts when the view is ready
const layer = webmap.layers.getItemAt(0);
view.whenLayerView(layer).then((layerView) => {
.whenOnce(() => !layerView.updating)
// Query layer view statistics as the user clicks
// or drags the pointer across the view.
view.on(["click", "drag"], (event) => {
// disables navigation by pointer drag
queryStatsOnDrag(layerView, event)
if (error.name !== "AbortError") {
* Queries statistics against the layer view at the given screen location
const queryStatsOnDrag = promiseUtils.debounce((layerView, event) => {
// create a query object for the highlight and the statistics query
const query = layerView.layer.createQuery();
query.geometry = view.toMap(event); // converts the screen point to a map point
query.distance = 1; // queries all features within 1 mile of the point
const statsQuery = query.clone();
// date used to calculate the average time a case has been opened
const dataDownloadDate = Date.UTC(2018, 6, 5);
// Create the statistic definitions for querying stats from the layer view
// the `onStatisticField` property can reference a field name or a SQL expression
// `outStatisticFieldName` is the name of the statistic you will reference in the result
// `statisticType` can be sum, avg, min, max, count, stddev
const statDefinitions = [
// Age of crime since it was reported in years
onStatisticField: "(" + dataDownloadDate + " - milliseconds) / (1000 * 60 * 60 * 24 * 365.25)",
outStatisticFieldName: "avg_open_time_years",
outStatisticFieldName: "total",
// total homicides by year
// Since separate fields don't exist for each year, we can use
// an expression to return a 1 or a 0 for each year and sum up the
// results to get the total.
onStatisticField: "CASE WHEN reported_year = 2008 THEN 1 ELSE 0 END",
outStatisticFieldName: "total_2008",
onStatisticField: "CASE WHEN reported_year = 2009 THEN 1 ELSE 0 END",
outStatisticFieldName: "total_2009",
onStatisticField: "CASE WHEN reported_year = 2010 THEN 1 ELSE 0 END",
outStatisticFieldName: "total_2010",
onStatisticField: "CASE WHEN reported_year = 2011 THEN 1 ELSE 0 END",
outStatisticFieldName: "total_2011",
onStatisticField: "CASE WHEN reported_year = 2012 THEN 1 ELSE 0 END",
outStatisticFieldName: "total_2012",
onStatisticField: "CASE WHEN reported_year = 2013 THEN 1 ELSE 0 END",
outStatisticFieldName: "total_2013",
onStatisticField: "CASE WHEN reported_year = 2014 THEN 1 ELSE 0 END",
outStatisticFieldName: "total_2014",
onStatisticField: "CASE WHEN reported_year = 2015 THEN 1 ELSE 0 END",
outStatisticFieldName: "total_2015",
onStatisticField: "CASE WHEN reported_year = 2016 THEN 1 ELSE 0 END",
outStatisticFieldName: "total_2016",
onStatisticField: "CASE WHEN reported_year = 2017 THEN 1 ELSE 0 END",
outStatisticFieldName: "total_2017",
// crime disposition (aka crime statu)
// Since this is a string field, we can use a similar technique to sum
// the total of each status of the crime
onStatisticField: "CASE WHEN disposition = 'Closed by arrest' THEN 1 ELSE 0 END",
outStatisticFieldName: "num_closed_arrest",
onStatisticField: "CASE WHEN disposition = 'Open/No arrest' THEN 1 ELSE 0 END",
outStatisticFieldName: "num_open",
onStatisticField: "CASE WHEN disposition = 'Closed without arrest' THEN 1 ELSE 0 END",
outStatisticFieldName: "num_closed_no_arrest",
// Some victim ages are unknown and indicated with a -99. We'll
// use an expression to treat those unknown ages as 0. This will
// skew the average age slightly downward since we can't exclude those
// values without a where clause. Do use a where clause, we could execute
onStatisticField: "CASE WHEN victim_age_years = -99 THEN 0 ELSE victim_age_years END",
outStatisticFieldName: "avg_age",
onStatisticField: "CASE WHEN victim_age_years = -99 THEN 1 ELSE 0 END",
outStatisticFieldName: "age_unknown",
onStatisticField: "CASE WHEN victim_age_years >= 0 AND victim_age_years <= 18 THEN 1 ELSE 0 END",
outStatisticFieldName: "age_18_under",
onStatisticField: "CASE WHEN victim_age_years >= 19 AND victim_age_years <= 30 THEN 1 ELSE 0 END",
outStatisticFieldName: "age_19_30",
onStatisticField: "CASE WHEN victim_age_years >= 31 AND victim_age_years <= 44 THEN 1 ELSE 0 END",
outStatisticFieldName: "age_31_44",
onStatisticField: "CASE WHEN victim_age_years >= 45 AND victim_age_years <= 65 THEN 1 ELSE 0 END",
outStatisticFieldName: "age_45_64",
onStatisticField: "CASE WHEN victim_age_years >= 65 THEN 1 ELSE 0 END",
outStatisticFieldName: "age_65_over",
onStatisticField: "CASE WHEN victim_sex = 'Male' THEN 1 ELSE 0 END",
outStatisticFieldName: "num_males",
onStatisticField: "CASE WHEN victim_sex = 'Female' THEN 1 ELSE 0 END",
outStatisticFieldName: "num_females",
onStatisticField: "CASE WHEN victim_sex = 'Unknown' THEN 1 ELSE 0 END",
outStatisticFieldName: "num_unknown_gender",
onStatisticField: "CASE WHEN victim_race = 'Asian' THEN 1 ELSE 0 END",
outStatisticFieldName: "num_asian",
onStatisticField: "CASE WHEN victim_race = 'Black' THEN 1 ELSE 0 END",
outStatisticFieldName: "num_black",
onStatisticField: "CASE WHEN victim_race = 'Hispanic' THEN 1 ELSE 0 END",
outStatisticFieldName: "num_hispanic",
onStatisticField: "CASE WHEN victim_race = 'White' THEN 1 ELSE 0 END",
outStatisticFieldName: "num_white",
// add the stat definitions to the statistics query object cloned earlier
statsQuery.outStatistics = statDefinitions;
// execute the query for all features in the layer view
const allStatsResponse = layerView.queryFeatures(statsQuery).then(
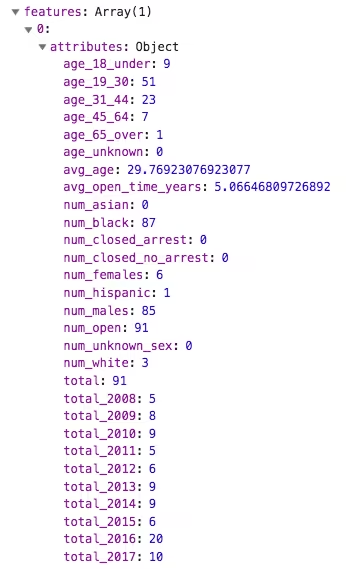
const stats = response.features[0].attributes;
const openStatsQuery = statsQuery.clone();
openStatsQuery.where = "disposition = 'Open/No arrest'";
// execute the query for only unsolved homicides in the layer view
const unsolvedStatsResponse = layerView.queryFeatures(openStatsQuery).then(
const stats = response.features[0].attributes;
// highlight all features within the query distance
layerView.queryObjectIds(query).then((ids) => {
highlightHandle.remove();
highlightHandle = layerView.highlight(ids);
// Return the promises that will resolve to each set of statistics
return promiseUtils.eachAlways([allStatsResponse, unsolvedStatsResponse]);
* Updates the charts with the data returned from the statistic queries.
function updateCharts(responses) {
const allStats = responses[0].value;
const unsolvedStats = responses[1].value;
allStats.total_2008 - unsolvedStats.total_2008,
allStats.total_2009 - unsolvedStats.total_2009,
allStats.total_2010 - unsolvedStats.total_2010,
allStats.total_2011 - unsolvedStats.total_2011,
allStats.total_2012 - unsolvedStats.total_2012,
allStats.total_2013 - unsolvedStats.total_2013,
allStats.total_2014 - unsolvedStats.total_2014,
allStats.total_2015 - unsolvedStats.total_2015,
allStats.total_2016 - unsolvedStats.total_2016,
allStats.total_2017 - unsolvedStats.total_2017,
unsolvedStats.total_2008,
unsolvedStats.total_2009,
unsolvedStats.total_2010,
unsolvedStats.total_2011,
unsolvedStats.total_2012,
unsolvedStats.total_2013,
unsolvedStats.total_2014,
unsolvedStats.total_2015,
unsolvedStats.total_2016,
unsolvedStats.total_2017,
updateChart(yearChart, yearChartStats);
allStats.age_65_over - unsolvedStats.age_65_over,
allStats.age_45_64 - unsolvedStats.age_45_64,
allStats.age_31_44 - unsolvedStats.age_31_44,
allStats.age_19_30 - unsolvedStats.age_19_30,
allStats.age_18_under - unsolvedStats.age_18_under,
allStats.age_unknown - unsolvedStats.age_unknown,
unsolvedStats.age_65_over,
unsolvedStats.age_18_under,
unsolvedStats.age_unknown,
updateChart(ageChart, ageChartStats);
const dispositionStats = [allStats.num_closed_arrest, allStats.num_closed_no_arrest, allStats.num_open];
updateChart(dispositionChart, dispositionStats);
allStats.num_males - unsolvedStats.num_males,
allStats.num_females - unsolvedStats.num_females,
unsolvedStats.num_females,
updateChart(genderChart, genderStats);
allStats.num_asian - unsolvedStats.num_asian,
allStats.num_black - unsolvedStats.num_black,
allStats.num_hispanic - unsolvedStats.num_hispanic,
unsolvedStats.num_hispanic,
allStats.num_white - unsolvedStats.num_white,
updateChart(raceChart, raceStats);
// Update the total numbers in the title UI element
avgAge.textContent = Math.round(allStats.avg_age);
totalNumber.textContent = allStats.total;
avgOpenTime.textContent =
unsolvedStats.avg_open_time_years != null ? unsolvedStats.avg_open_time_years.toFixed(1) : 0;
* Updates the given chart with new data
function updateChart(chart, dataValues) {
if (chart.config.type === "doughnut") {
chart.data.datasets[0].data = dataValues;
chart.data.datasets[0].data = dataValues.solved;
chart.data.datasets[1].data = dataValues.unsolved;
* Creates 5 charts for summarizing homicide data
function createCharts() {
totalNumber = document.getElementById("num-homicides");
avgAge = document.getElementById("avg-age");
avgOpenTime = document.getElementById("avg-open-time");
const yearCanvas = document.getElementById("year-chart");
yearChart = new Chart(yearCanvas.getContext("2d"), {
labels: ["2008", "2009", "2010", "2011", "2012", "2013", "2014", "2015", "2016", "2017"],
backgroundColor: "#149dcf",
data: [0, 0, 0, 0, 0, 0, 0, 0, 0, 0],
label: "Remains unsolved",
backgroundColor: "#ed5050",
data: [0, 0, 0, 0, 0, 0, 0, 0, 0, 0],
text: "Homicides by year",
const ageCanvas = document.getElementById("age-chart");
ageChart = new Chart(ageCanvas.getContext("2d"), {
labels: ["65+", "45-64", "31-44", "18-30", "0-18", "Not sure"],
backgroundColor: "#149dcf",
data: [0, 0, 0, 0, 0, 0],
label: "Remains unsolved",
backgroundColor: "#ed5050",
data: [0, 0, 0, 0, 0, 0],
text: "Homicides by age",
const dispositionCanvas = document.getElementById("disposition-chart");
dispositionChart = new Chart(dispositionCanvas.getContext("2d"), {
labels: ["Closed by arrest", "Closed without arrest", "Open/No arrest"],
backgroundColor: ["#149dcf", "#a6c736", "#ed5050"],
borderColor: "rgb(255, 255, 255)",
text: "Status of the case",
const genderCanvas = document.getElementById("gender-chart");
genderChart = new Chart(genderCanvas.getContext("2d"), {
labels: ["Male (solved)", "Male (unsolved)", "Female (solved)", "Female (unsolved)"],
backgroundColor: ["#149dcf", "#0a4d66", "#ed5050", "#7c2525"],
borderColor: "rgb(255, 255, 255)",
text: "Gender of the victim",
const raceCanvas = document.getElementById("race-chart");
raceChart = new Chart(raceCanvas.getContext("2d"), {
borderColor: "rgb(255, 255, 255)",
data: [0, 0, 0, 0, 0, 0, 0, 0],
text: "Race of the victim",
<div style="padding: 15px">
<canvas id="year-chart" height="250" width="550"></canvas>
<canvas id="age-chart" height="250" width="550"></canvas>
<canvas id="disposition-chart" width="200" height="350" style="float: left"></canvas>
<canvas id="gender-chart" width="200" height="350" style="float: left"></canvas>
<canvas id="race-chart" width="200" height="350" style="float: left"></canvas>