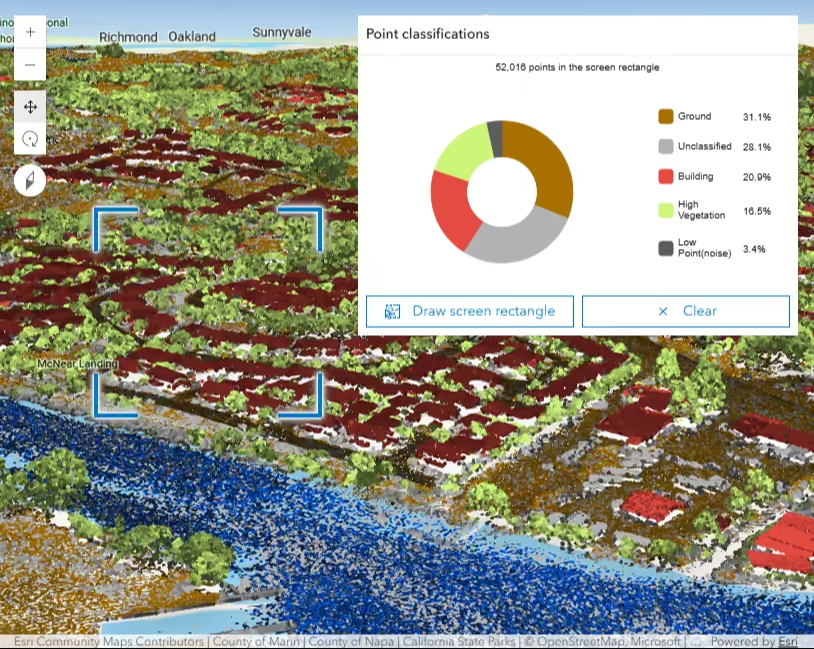
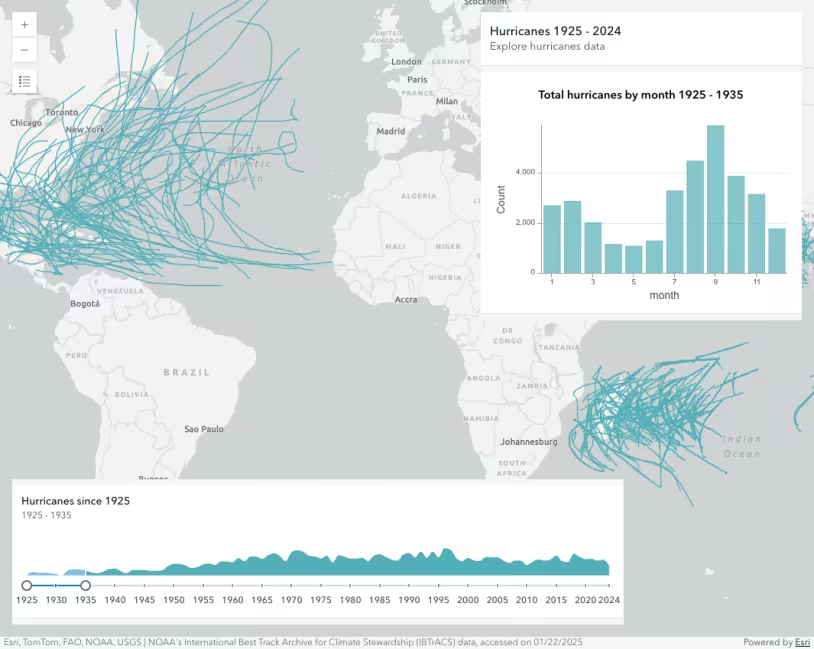
The sample loads a WebMap containing a FeatureLayer to a Map component. The layer shows the predominant education level achieved among residents aged 12 and older in each municipality of Mexico, using an Arcade expression in a UniqueValueRenderer. The web map also includes a chart component that displays the total population in each education category within the map extent. The chart updates whenever the user pans or zooms on the map.
How it works
After the map component is ready, the predominance feature layer is retrieved from the web map and its outFields are set to include the EDUCA_BASE field, allowing the layer’s FeatureLayerView to access the necessary attributes on the client-side.
// Get the layer from the webmap and set its outFields to EDUCA_BASE.// We need this field on the client calculate total number of residents aged 12+const predominanceLayer = findLayerByTitle("Educational Attainment by City");predominanceLayer.outFields = ["EDUCA_BASE"];The pie chart is loaded with the arcgis-chart component by using the layer-item-id and chart-index properties.
By using reference-element, the chart can be associated with the map component.
The chart is set up to display the total population in each education category for the current map extent by setting the filter-by-view-extent property. The chart automatically refreshes whenever the user pans or zooms on the map, ensuring it always reflects the view extent. See the HTML snippet below for the configuration:
<arcgis-chart layer-item-id="5d9b6fddedba45d7b86a1e7dbb1bc278" chart-index="0" id="pie-chart" reference-element="map-element" filter-by-view-extent legend-interactions-disabled interactions-disabled hide-loader-animation></arcgis-chart>Next, the sample calculates the total number of residents aged 12 and older within the current extent. This query runs client-side whenever the layer view finishes fetching new features, for example, after the user pans or zooms the map. We handle this by watching the dataUpdating property of the layer view and triggering the query when it becomes false. See the code snippet below for the implementation:
// Wait until the layerView has finished fetching data for the current extent,// then query sum statistics to get the total number of residents aged 12+reactiveUtils.when( () => !layerView.dataUpdating, async () => { await queryLayerViewStats(layerView); },);When the layer view completes fetching features, the queryLayerViewStats function is called. This function creates a StatisticDefinition to sum the values of the EDUCA_BASE field for all features within the map’s extent. It then calls the queryFeatures method on the layer view to execute the statistics query. In this sample, that sum represents the total number of people in each educational attainment category.
With in the function, call the loadModel method on the pie chart element before setting its title and configuring the legend.
The resulting value from the statistics query can be set as the chart’s title using the titleText property of the pie chart model.
// Called whenever layerView.dataUpdating becomes falseasync function queryLayerViewStats(layerView) {  const fieldName = "EDUCA_BASE";
  // Set stats definition to get the total number of residents aged 12+  // in municipalities visible in the view extent  const statDefinition = {    onStatisticField: fieldName,    outStatisticFieldName: fieldName + "_TOTAL",    statisticType: "sum",  };
  // Query statistics for features only in view extent  const query = layerView.layer.createQuery();  query.outStatistics = [statDefinition];  query.geometry = viewElement.extent;
  const response = await layerView.queryFeatures(query);  const totalCount = response.features?.[0]?.attributes?.EDUCA_BASE_TOTAL || 0;  const title = numberWithCommas(totalCount) + " people (age 12+)";
  // Load the chart model before setting its title  await pieChartElement.loadModel();
  // Configure the pie chart legend  pieChartElement.model.legendVisibility = true;  pieChartElement.model.legendMaxHeight = 400;  pieChartElement.model.displayPercentageOnLegendItems = false;
  // Set the chart title to show total population aged 12+  pieChartElement.model.titleText = title;}