Binning with aggregate fields

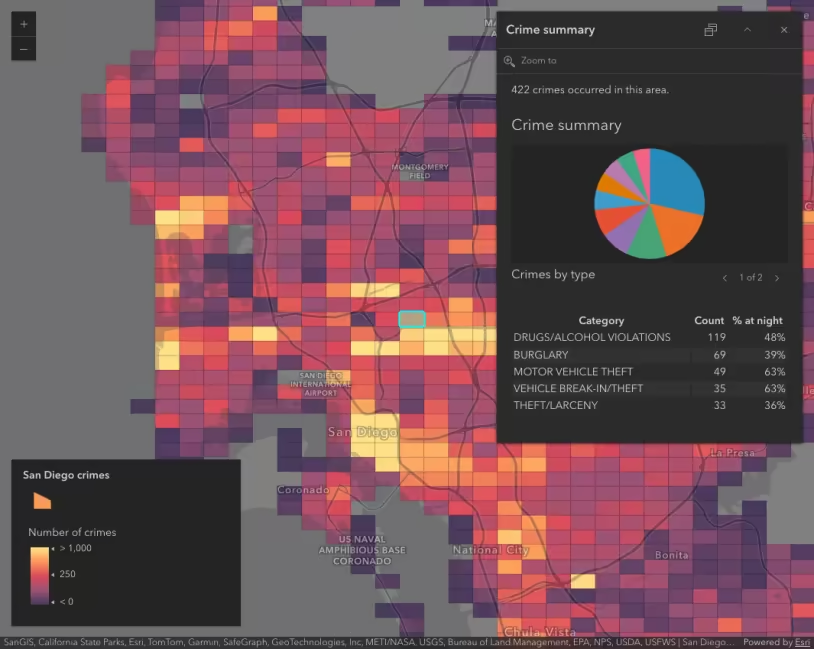
This sample demonstrates how to enable binning on a FeatureLayer and aggregate numeric attributes to use in the renderer, popupTemplate and labels of the bins.
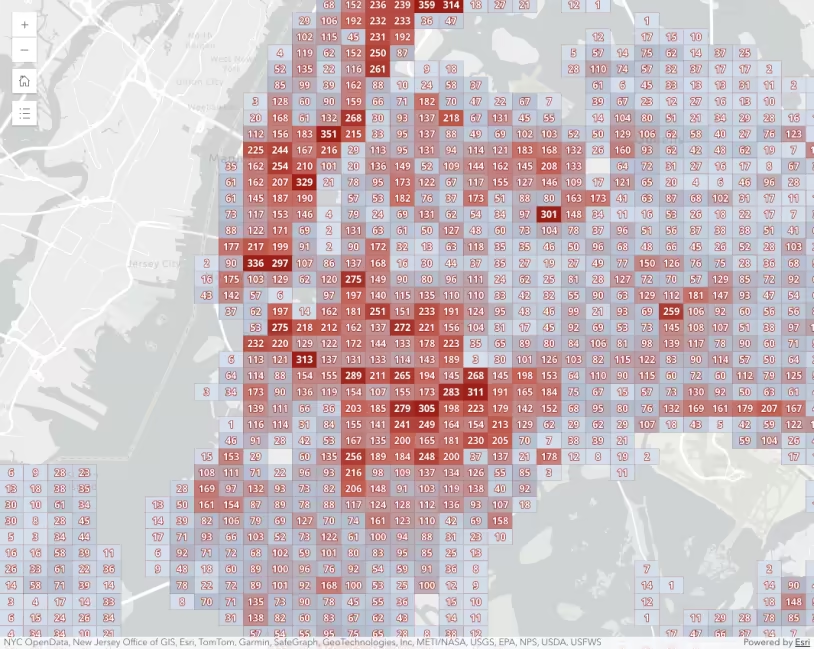
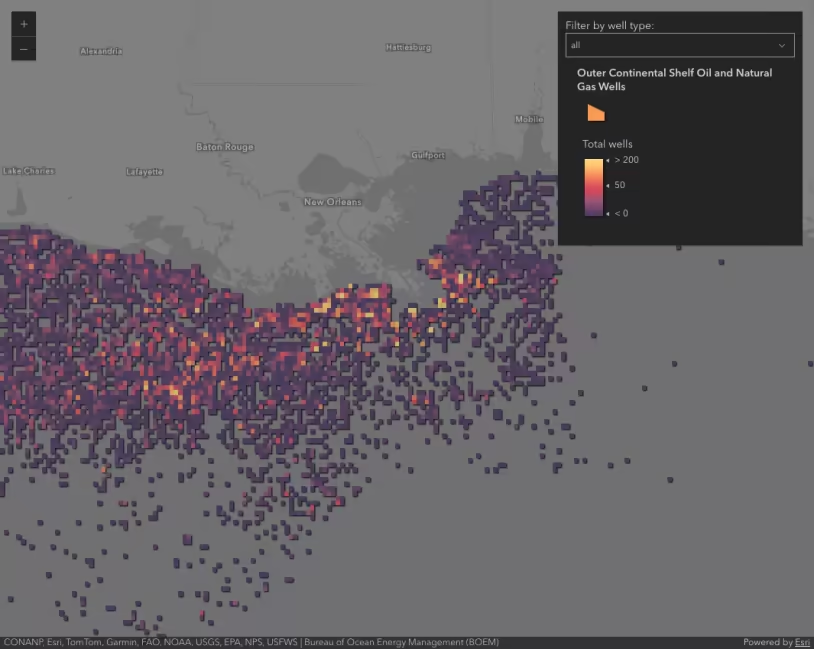
Binning is a method of aggregating points in a FeatureLayer, CSVLayer, GeoJSONLayer, WFSLayer, or OGCFeatureLayer by grouping them in predefined bins. Bins are generated using geohashes.

Aggregate fields are defined in the fields property of the FeatureReductionBinning class. Once defined, these fields may be used in the renderer, labels, and popup of the bins. The lines highlighted in green in the snippet below show how aggregate fields are defined. Lines highlighted in blue show where these fields are used.

Define aggregate fields
Use dark colors for code blocks
55 55 55 55 55 55 55 55 55 55 55 55 55 55 55 55 55 55 55 55 55 55 55 55 55 55 55 55 55 55 55 55 55 55 55 55 55 55 55 55 55 55 55 55 55 55 55 55 55 55 55 55 55 55 55 56 57 58 59 60 61 62 63 64 65 66 67 68 69 70 71 72 73 74 75 76 77 78 79 80 81 82 83 84 85 86 87 88 89 90 91 92 93 94 95 96 97 98 99 100 101 102 103 104 105 106 107 108 109 110 111 112 113 114 115 116 117 118 119 120 121 122 123 124 125 126 127 128 129 130 131 132 133 134 135 136 137 138 139 140 141 142 143 144 145 146 147 148 149 150 151 152 153 154 155 156 157 158 159 160 161 162 163 164 165 166 167 168 169 170 171 172 173 174 175 176 177 178 179 180 181 182 183 184 185 186 187 188 189 190 191 192 193 194 195 196 197 198 199 200 201 202 203 204 205 206 207 208 209 210 211 212 213 214 215 216 217 218 219 220 221 222 223 223 223 223 223 223 223 223 223 223 223 223 223 223 223 223 223 223 223 223 223 223 223 223 223 223 223 223 223 223 223 223 223 223 223 223 223 223 223 223 223 223 223 223 223 223 223 223 223 223 223 223 223 223 223 223 223 223 223 223 223 223 223 223 223 223 223 223 223 223 223 223 223 223 223 223 223 223 223 223 223 223 223 223 223 223 223 223 223 223 223 223 223 223 223
Add line.Add line.Add line.Add line.Add line.Add line.Add line.Add line.Add line.Add line.Add line.Add line.Add line.Add line.Add line.Add line.Add line.Add line.Add line.Add line.Add line.Add line.Add line.Add line.Add line.Add line.Add line.Add line.Add line.Add line.Add line.Add line.Add line.Add line.Add line.Add line.Add line.Add line.Add line.Add line.Add line.Add line.
1
2
3
4
5
6
7
8
9
10
11
12
13
14
15
16
17
18
19
20
21
22
23
24
25
26
27
28
29
30
31
32
33
34
35
36
37
38
39
40
41
42
43
44
45
46
47
48
49
50
51
52
53
54
55
56
57
58
59
60
61
62
63
64
65
66
67
68
69
70
71
72
73
74
75
76
77
78
79
80
81
82
83
84
85
86
87
88
89
90
91
92
93
94
95
96
97
98
99
100
101
102
103
104
105
106
107
108
109
110
111
112
113
114
115
116
117
118
119
120
121
122
123
124
125
126
127
128
129
130
131
132
133
134
135
136
137
138
139
140
141
142
143
144
145
146
147
148
149
150
151
152
153
154
155
156
157
158
159
160
161
162
163
164
165
166
167
168
169
170
171
172
173
174
175
176
177
178
179
180
181
182
183
184
185
186
187
188
189
190
191
192
193
194
195
196
197
198
199
200
201
202
203
204
205
206
207
208
209
210
211
212
213
214
215
216
217
218
219
220
221
222
223
224
225
226
227
228
229
230
231
232
233
234
235
236
237
238
239
240
241
242
243
244
245
246
247
248
249
250
251
252
253
254
255
256
257
258
259
260
261
262
263
264
265
266
267
268
269
270
271
272
273
274
275
276
277
278
279
280
281
282
283
284
285
286
287
288
289
290
291
292
293
294
295
296
297
298
299
300
301
302
303
304
305
306
307
308
309
310
311
312
313
314
315
316
317
      const featureReduction = {
        type: "binning",
        fixedBinLevel: 6,

        fields: [
          new AggregateField({
            name: "aggregateCount",
            statisticType: "count"
          }),
          new AggregateField({
            name: "SUM_PERSONS_INJURED",
            alias: "Total number of persons injured",
            onStatisticField: "NUMBER_OF_PERSONS_INJURED",
            statisticType: "sum"
          }),
          new AggregateField({
            name: "SUM_PEDESTRIANS_INJURED",
            alias: "Number of pedestrians injured",
            onStatisticField: "NUMBER_OF_PEDESTRIANS_INJURED",
            statisticType: "sum"
          }),
          new AggregateField({
            name: "SUM_CYCLIST_INJURED",
            alias: "Number of cyclists injured",
            onStatisticField: "NUMBER_OF_CYCLIST_INJURED",
            statisticType: "sum"
          }),
          new AggregateField({
            name: "SUM_MOTORIST_INJURED",
            alias: "Number of cyclists injured",
            onStatisticField: "NUMBER_OF_MOTORIST_INJURED",
            statisticType: "sum"
          }),
          new AggregateField({
            name: "AVG_MOTORIST_INJURED",
            alias: "Ratio of motorist injuries to crashes",
            onStatisticField: "NUMBER_OF_MOTORIST_INJURED",
            statisticType: "avg"
          }),
          new AggregateField({
            name: "SUM_KILLED",
            alias: "Total fatalities",
            onStatisticField: "NUMBER_OF_PERSONS_KILLED",
            statisticType: "sum"
          }),
        ],

        labelsVisible: true,
        labelingInfo: [
          new LabelClass({
            minScale: 36112,
            maxScale: 0,
            deconflictionStrategy: "none",
            symbol: {
              type: "text",  // autocasts as new TextSymbol()
              color: "white",
              font: {
                family: "Noto Sans",
                size: 12,
                weight: "bold"
              },
              haloColor: colors[4],
              haloSize: 0.5
            },
            labelExpressionInfo: {
              expression: "Text($feature.AVG_MOTORIST_INJURED, '#%')"
            }
          })
        ],
        popupEnabled: true,
        popupTemplate: {
          title: "Crash summary",
          content: [{
            type: "text",
            text: "{aggregateCount} car crashes occurred in this area."
          }, {
            type: "fields",
            fieldInfos: [{
              fieldName: "aggregateCount",
              label: "Total crashes",
              format: {
                places: 0,
                digitSeparator: true
              }
            }, {
              fieldName: "SUM_PERSONS_INJURED",
              label: "Total injured",
              format: {
                places: 0,
                digitSeparator: true
              }
            }, {
              fieldName: "SUM_PEDESTRIANS_INJURED",
              label: "Pedestrians injured"
            }, {
              fieldName: "SUM_CYCLIST_INJURED",
              label: "Cyclists injured"
            }, {
              fieldName: "SUM_MOTORIST_INJURED",
              label: "Motorists injured"
            }, {
              fieldName: "SUM_KILLED",
              label: "Total killed"
            }]
          }]
        },
        renderer: {
          type: "simple",
          symbol: {
            type: "simple-marker",
            color: [0, 255, 71, 1],
            outline: null,
            outline: {
              color: "rgba(153, 31, 23, 0.3)",
              width: 0.3,
            },
          },
          visualVariables: [
            {
              type: "size",
              field: "aggregateCount",
              legendOptions: {
                title: "Total crashes"
              },
              minSize: {
                type: "size",
                valueExpression: "$view.scale",
                stops: [
                  { value: 18055, size: 18 },
                  { value: 36111, size: 12 },
                  { value: 72223, size: 8 },
                  { value: 144447, size: 4 },
                  { value: 288895, size: 2 },
                  { value: 577790, size: 1 },
                ]
              },
              maxSize: {
                type: "size",
                valueExpression: "$view.scale",
                stops: [
                  { value: 18055, size: 48 },
                  { value: 36111, size: 32 },
                  { value: 72223, size: 24 },
                  { value: 144447, size: 18 },
                  { value: 288895, size: 12 },
                  { value: 577790, size: 6 },
                ]
              },
              minDataValue: 10,
              maxDataValue: 300
            },
            {
              type: "color",
              field: "AVG_MOTORIST_INJURED",
              legendOptions: {
                title: "% of motorists injured per crash"
              },
              stops: [
                { value: 0, color: colors[0], label: "No injuries" },
                { value: 0.1, color: colors[1] },
                { value: 0.3, color: colors[2], label: "30%" },
                { value: 0.5, color: colors[3] },
                { value: 0.75, color: colors[4], label: ">75%" }
              ]
            }
          ]
        }
      };
Image preview of related sample Intro to binning

Intro to binning

Aggregate points to bins to visualize their density.

Image preview of related sample Binning - Filter by category

Binning - Filter by category

Demonstrates how to filter binned data by category.

Image preview of related sample Summarize binned data using Arcade

Summarize binned data using Arcade

Use Arcade in popups to summarize binned crimes by type

FeatureReductionBinning

Read the API Reference for more information.

Your browser is no longer supported. Please upgrade your browser for the best experience. See our browser deprecation post for more details.