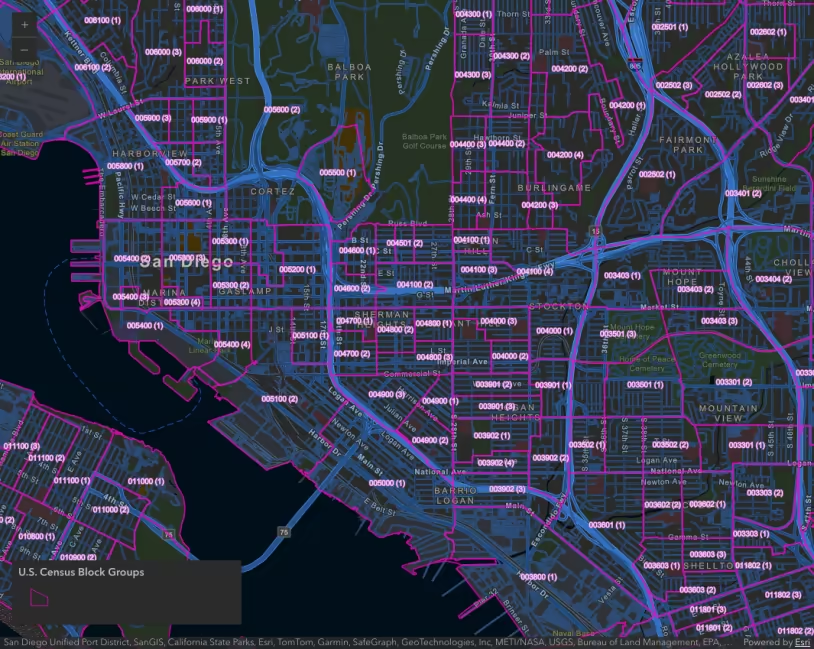
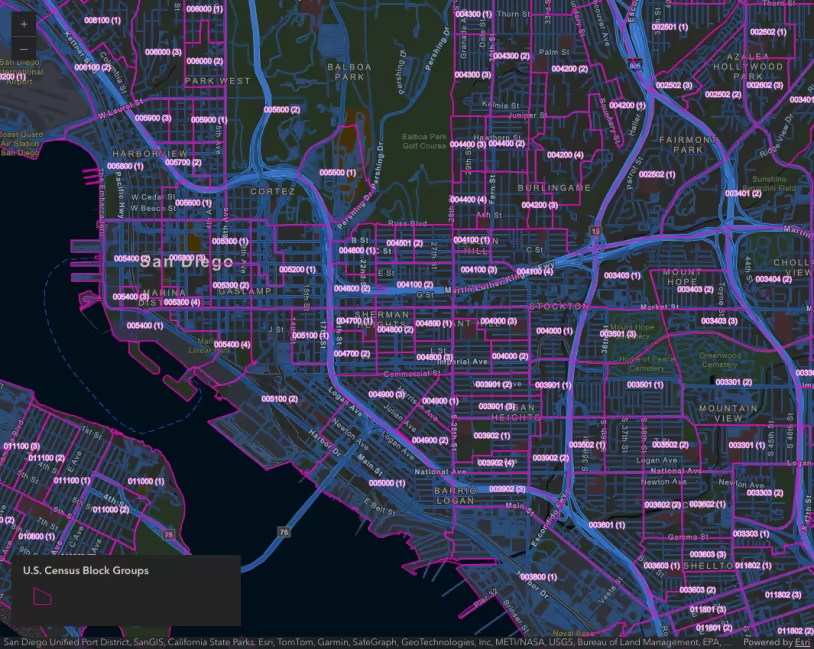
This sample demonstrates how to summarize binned features by category using charts in a popup. The app visualizes crimes in San Diego, California as bins. Each bin’s popup displays a pie chart showing the proportion of crimes committed by category or type, a column chart showing the number of crimes committed during each month of the year, and a table describing the percentage of crimes committed at night by category.
The list and charts are created using ExpressionContent popup elements, which can be used to conditionally build rich text, charts, or field lists with Arcade expressions. Expressions that return popup elements must return a dictionary representing the web map specification of the desired content element. The following popup elements are supported: TextContent, FieldsContent, and MediaContent.
Create an HTML list with Arcade
To return HTML from an Arcade expression, the HTML must be returned as a TextContent element. Expressions for building a text content element must return a dictionary matching the following specification:
return { type: "text", text: "<b>The text to display in the popup</b>"}Because TextContent can contain rich text, we can dynamically build HTML elements as a text value within an Arcade expression. Note that you cannot return HTML in Arcade in any other case, such as displaying an expression value from the PopupTemplate.expressionInfos property.
The following expression demonstrates how this works. Read the comments for details.
Expects($aggregatedFeatures, "is_night", "type");
var crimes = $aggregatedFeatures;
// Queries the count of crimes grouped by the "type" field// and returns the percentage that occurred at nightvar stats = GroupBy(crimes, ["type"],  [    { name: "total", expression: "1", statistic: "count" },    { name: "nightPercent", expression: "is_night", statistic: "avg" }  ]);
// Orders the results in descending order by the total countvar topCrimes = Top(OrderBy(stats, "total desc"), 5);
if(Count(topCrimes) == 0){  return {    type: "text",    text: "No crimes committed in this area"  };}
// Build an HTML table to display the summary of// crimes by count and how many occurred at nightvar cssGray = "style='background-color:#323232;'";var cssRight = "style='text-align: right;'";var cssCenter = "style='text-align: center;'";
var table = "<table>";table += `<tr>  <td ${cssCenter}><b>Category</b></td>  <td ${cssCenter}><b>Count</b></td>  <td ${cssCenter}><b>% at night</b></td></tr>`;
var i = 0;for(var item in topCrimes){  var num_crimes = Text(item.total, "#,###");  var night_percent = Text(item.nightPercent, "#%");  var crimeType = item["type"];
  table += `<tr ${IIF( i % 2 != 0, cssGray, null )}>    <td>${crimeType}</td>    <td ${cssRight}>${num_crimes}</td>    <td ${cssRight}>${night_percent}</td>  </tr>`;  i++;}table += "</table>";
// Return the table as a text elementreturn {  type: "text",  text: table};
Create popup charts with Arcade
Expressions for charts must return a dictionary matching the web map specification of a MediaContent element:
return { type: "media", attributes: { field1: number, field2: number }, title: "Media content title", mediaInfos: [ { type: "piechart", // can also be "columnchart", "linechart", "piechart", "image" title: "Chart title", value: { // the list of attribute values to include in the chart fields: [ "field1", "field2" ] } } // you can define more charts here ]}When implemented in JavaScript, the charts can be defined with a list of field names. However, when dynamically creating charts with Arcade, you must create an attributes dictionary that stores key-value pairs containing the data to use in the chart. The keys are the field names to reference in the fields property of the chart value.
The following expression demonstrates how this works by creating a pie chart and a line chart. Read the comments for details.
Expects($aggregatedFeatures, "type", "month");var attributes = {};var pieFieldNames = [];var monthFieldNames = ["January", "February", "March", "April", "May", "June", "July", "August", "September", "October", "November", "December"];
var crimes = $aggregatedFeatures;
// Queries the count of crimes grouped by the "type" fieldvar typeStats = GroupBy(crimes, ["type"],  [{ name: "total", expression: "1", statistic: "count" }]);// Orders the results in descending order by the total countvar topCrimes = Top(OrderBy(typeStats, "total desc"), 10);
// Queries the count of crimes grouped by the "month" fieldvar monthStats = GroupBy(crimes, ["month"],  [{ name: "total", expression: "1", statistic: "count" }]);
if(Count(topCrimes) == 0){  return {    type: "text",    text: "No crimes committed in this area"  };}
// Create field names for the number of// crimes by type/category and push// the data values to the attributes dictionaryfor(var item in topCrimes){  var num_crimes = item.total;  var crimeType = item["type"];  attributes[crimeType] = num_crimes;  Push(pieFieldNames, crimeType);}
// Push the total number of crimes for each// month to the attributes dictionary.// Since the months are categorized as numbers 1-12,// We can use the Text function to format these as// long month names to match the field names defined above.for(var item in monthStats){  var num_crimes = item.total;  var crimeMonth = Text(Date(2010,item.month-1,1), "MMMM");  attributes[crimeMonth] = num_crimes;}
// Return the charts as media info objectsreturn {  type: "media",  attributes: attributes,  title: "Crime summary",  mediaInfos: [{    type: "piechart",    title: "Crimes by type",    value: {      fields: pieFieldNames    }  }, {    type: "linechart",    title: "Crimes by month",    value: {      fields: monthFieldNames    }  }]};
The expressions are added directly to an ExpressionContent element within the popupTemplate content.
layer.featureReduction = { type: "binning", fields: [ { name: "aggregateCount", statisticType: "count", }, ], popupTemplate: { title: "Crime summary", content: [ { type: "text", text: "{aggregateCount} crimes occurred in this area.", }, { type: "expression", expressionInfo: { expression: `// chart expression here`, }, }, { type: "expression", expressionInfo: { expression: `// table expression here`, }, }, ], fieldInfos: [ { fieldName: "aggregateCount", format: { digitSeparator: true, places: 0, }, }, ], },};Related samples and resources
Intro to binning
Binning with aggregate fields
Binning - Filter by category
Popup charts for clusters
Summarize intersecting points in a popup