What is Arcade?
Arcade is an expression language that can perform mathematical calculations and evaluate logical statements in visualizations, popup content, and labels within ArcGIS apps (i.e. ArcGIS Pro, ArcGIS Online, the ArcGIS Runtime APIs, and the ArcGIS Maps SDK for JavaScript
How to write Arcade expressions
In many respects Arcade’s syntax is similar to JavaScript, allowing you to declare variables, perform logical operations, take advantage of built-in functions, and write custom functions. However, there are key differences between the two languages. Read the full Arcade documentation including guides and the function reference for details on how to write an Arcade expression. You also have access to a playground that provides an environment for testing expressions with test datasets.
Profile variables give expressions access to data values connected to a layer, map, or workspace. These values are the inputs to the expression, required for producing a valid return value as defined by the expression author. For example $feature provides expressions access to a feature’s attributes and geometries.
Within JavaScript apps, Arcade expressions are always referenced as a string value. When writing single-line expressions, you can simply wrap it in double or single quotes.
// returns the % of the population that is age 18 and olderrenderer.valueExpression = "Round( ($feature.AGE_18UP / $feature.TOTAL_POP) * 100 )";You can use template literals (ES6 or later) to write multi-line Arcade expressions.
renderer.valueExpression = `  var republican = $feature.MP06025a_B;  var democrat = $feature.MP06024a_B;  var independent = $feature.MP06026a_B;
  var parties = [ republican, democrat, independent ];  var total = Sum(parties);  var max = Max(parties);  return (max / total) * 100;`;
Keep in mind that Arcade text values also support template literals. Since Arcade expressions are stored as strings in the ArcGIS Maps SDK for JavaScript
layer.popupTemplate = {  content: "{expression/percent-unemployed}",  expressionInfos: [    {      name: "percent-unemployed",      title: "Percent unemployed",      expression: `        var unemploymentRate = ( $feature.UNEMP_CY / $feature.LABOR_FORCE ) * 100;        var population = $feature.POP_16UP;        var populationNotWorking = ( ( $feature.UNEMP_CY + $feature.NOT_LABORFORCE_16 ) / $feature.POP_16UP ) * 100;
        // returns a string built using an Arcade template literal
        return \`\${$feature.COUNTY} County
        - Unemployment rate: \${Text(unemploymentRate, "##.#")}%        - % population not working: \${Text(populationNotWorking, "##.#")}%        - Population: \${Text(population, "#,###")}\`      `,    },  ],};
The Summarize intersecting points in a popup sample demonstrates another example of Arcade template literals. If you aren’t writing ES6 code, you can place the expression in a separate <script> tag outside the JavaScript, and set the type to text/plain with a unique ID to reference the script in the appropriate place within JavaScript.
<script type="text/plain" id="adult-population">  var republican = $feature.MP06025a_B;  var democrat = $feature.MP06024a_B;  var independent = $feature.MP06026a_B;
  var parties = [ republican, democrat, independent ];  var total = Sum(parties);  var max = Max(parties);  return (max / total) * 100;</script>
Then reference the script as a string value by calling the document.getElementById() method.
renderer.valueExpression = document.getElementById("adult-population").text;See the example snippets below and the Create a custom visualization using Arcade sample for more context.
Where can I use Arcade?
Arcade can only be executed within a valid profile. Profiles define rules or specifications for writing a valid expression. This includes defining the valid data inputs (profile variables), supported functions, and return types in addition to the context where they can execute.
Arcade is self-contained and executes on a feature-by-feature basis. Profiles ensure expressions are secure and performant given the context in which they execute. For example, Arcade allows you to define data values driving a visualization. If your layer has 100,000 features and has a renderer defined with an Arcade expression, that expression must execute 100,000 times to properly render the data. Because of this, the visualization profile prevents you from accessing data from sources outside the original feature since this would severely slow down app performance. In popups, however, you can access data from any layer in a map or service within an Arcade expression because you can performantly do so since only one expression executes at a time (when the popup is opened).
The following sections below describe the places in the JavaScript API where you can write Arcade expressions. Each provides links to the profile specification defining expression rules given the context along with live examples.
Labeling
- Specification: Labeling profile
- Live examples: Add labels to a FeatureLayer, Multi-line labels, Add multiple label classes to a layer, Label features using Arcade expressions (3D)
Arcade is used to create label expressions for features in a FeatureLayer or SceneLayer. Starting at version 4.5 of the API, this is the only supported method for labeling features. You must add at least one LabelClass to the labelingInfo property of the layer. The Arcade expression must be passed as a string value to the expression property of the LabelClass’s labelExpressionInfo object.
// returns the value of a field in the layer// the value of this field will be the label for each featureconst arcade = "$feature.STATION_NAME";
// this object autocasts as new LabelClass()const labelClass = {  // set the arcade expression to the `expression` property of labelExpressionInfo  labelExpressionInfo: {    expression: arcade,  },  labelPlacement: "below-right",  minScale: 2500000,  symbol: {    type: "label-3d",    symbolLayers: [      {        type: "text",        material: { color: "white" },        halo: {          color: "black",          size: 1,        },        size: 8,      },    ],  },};
// set the label class to the feature layerfeatureLayer.labelingInfo = [labelClass];
Label expressions written in Arcade may be more complex, containing multiple lines that perform mathematical and logical operations. For example, the Multi-line labels sample demonstrates how to construct a more complex multi-line label expression. This expression assigns two numeric field values to their own variables, evaluates them, and returns a string value. Arcade’s When() function is used to evaluate the wind direction (between 0-360 degrees), which returns the associated compass direction of either N, NE, E, SE, S, SW, W, or NW. If the wind speed is 0, then no direction is returned. The final line of the expression returns the label, which is the value of the WIND variable.
<script type="text/plain" id="wind-direction"> var DEG = $feature.WIND_DIRECT; var SPEED = $feature.WIND_SPEED; var DIR = When( SPEED == 0, '', (DEG < 22.5 && DEG >= 0) || DEG > 337.5, 'N', DEG >= 22.5 && DEG < 67.5, 'NE', DEG >= 67.5 && DEG < 112.5, 'E', DEG >= 112.5 && DEG < 157.5, 'SE', DEG >= 157.5 && DEG < 202.5, 'S', DEG >= 202.5 && DEG < 247.5, 'SW', DEG >= 247.5 && DEG < 292.5, 'W', DEG >= 292.5 && DEG < 337.5, 'NW', '' ); var WIND = SPEED + ' mph ' + DIR; return WIND;</script>There are many additional Arcade functions useful for labeling, including text functions that provide logic for text formatting. Be sure to check out the full Arcade documentation for more information regarding these built-in functions.
Popups
Arcade is implemented in two popup profiles:
- Popup - For calculating attributes to display in a layer’s popup content or a feature reduction popup. This is useful for simple calculations.
- Popup Element - For conditionally creating popup elements in a layer’s popup or a feature reduction popup. This should be used if you want a single expression to return multiple values in a single popup element.
Popup
- Specification: Popup profile
- Layer examples: Reference Arcade expressions in PopupTemplate, Summarize intersecting points in a popup
- Clustering examples: Clustering - filter popup features
Arcade expressions can be referenced within the content of a PopupTemplate. This is useful for situations when you want to display data that isn’t present as an attribute value in your layer. In the popup profile, expressions must return a text or a number value, and may access a feature’s attributes with $feature, or data from other features and layers using $layer, $map, and $datastore.
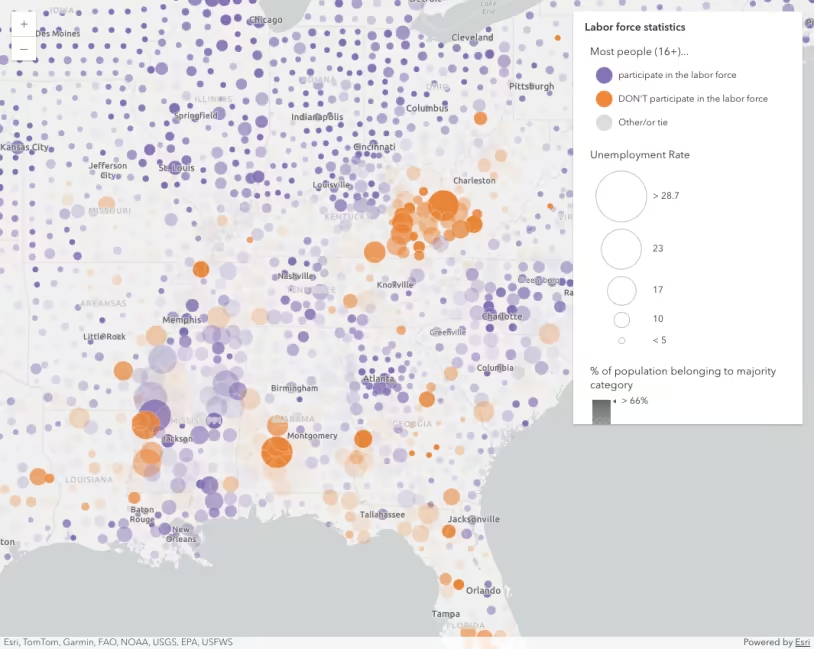
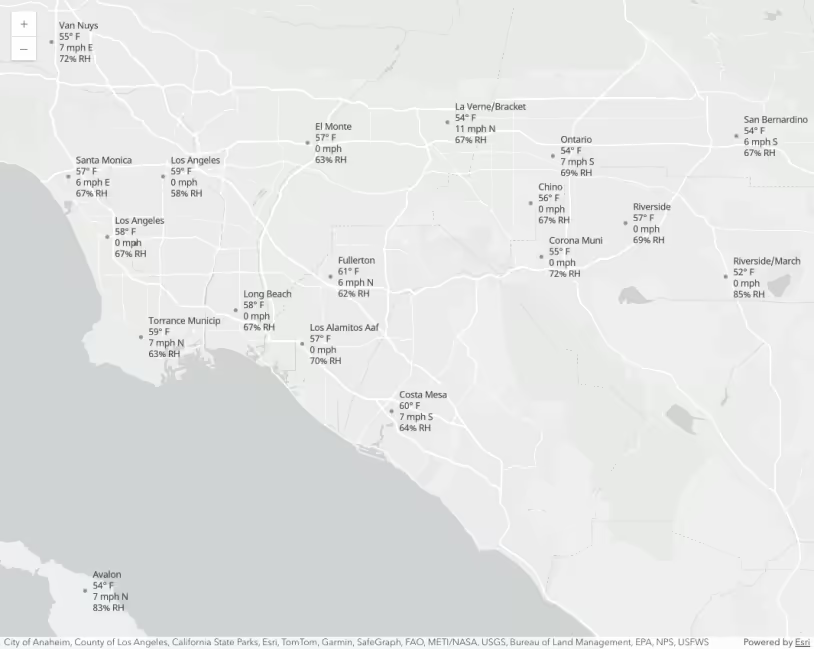
For example, the Reference Arcade expressions in PopupTemplate sample displays a layer containing labor statistics for each U.S. county. Some attributes include unemployment rate, population, and the number of people participating in the labor force. It does not have an attribute for labor force participation rate. We can use Arcade to calculate that for us at runtime.
// labor force participation rateRound(($feature.CIVLBFR_CY / $feature.POP_16UP) * 100, 2);The value returned from this expression can be displayed in the layer’s popupTemplate. To view the value in the popup, we must reference it in the expressionInfos property of the PopupTemplate and assign it a name and a title.
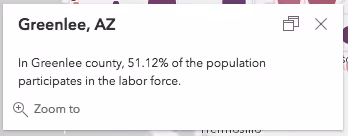
layer.popupTemplate = { expressionInfos: [ { name: "participation-rate", title: "% of population 16+ participating in the labor force", expression: "Round(($feature.CIVLBFR_CY / $feature.POP_16UP)*100,2)", }, ], content: "In {NAME} county, {expression/participation-rate}% of the population" + " participates in the labor force.",};Notice that once the expression exists in the expressionInfos property, you can reference the value returned from the expression using the {expression/expression-name} placeholder template within the content of the PopupTemplate. The Popup’s content would display the following after the user clicked a feature representing Greenlee, AZ:
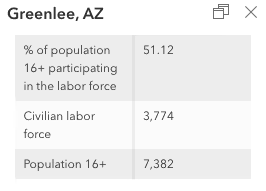
You can also reference values returned from Arcade expressions inside popup content elements, including FieldsContent, MediaContent, and TextContent. Just reference the name of the expression in the fieldName property of the object. Remember to use the expression/expression-name syntax.
layer.popupTemplate = { expressionInfos: [ { name: "participation-rate", title: "% of population 16+ participating in the labor force", expression: "Round(($feature.CIVLBFR_CY / $feature.POP_16UP)*100,2)", }, ], content: [ { type: "fields", fieldInfos: [ { fieldName: "expression/participation-rate", }, { fieldName: "CIVLBFR_CY", label: "Civilian labor force", format: { places: 0, digitSeparator: true, }, }, { fieldName: "POP_16UP", label: "Population 16+", format: { places: 0, digitSeparator: true, }, }, ], }, ],};The popup will display the following:
View the Reference Arcade expressions in PopupTemplate sample to see this workflow in the context of a live sample.
Feature Reduction Popup
In addition to layer popups, Arcade expressions can be referenced within the content of a cluster popupTemplate. This is slightly different than layer popups because $feature represents the cluster itself, which summarizes two or more features.
$feature always contains the cluster_count field, in addition to other fields that summarize the layer’s renderer (e.g. cluster_avg_fieldName).
// returns the sum of the cost field for all features in the cluster$feature.cluster_count * $feature.cluster_avg_costThis profile also gives you access to the features contained within the cluster via the $aggregatedFeatures profile variable. You can filter the aggregated features, iterate through them, sort them, and calculate statistics with them.
// returns the total number of car crashes// that resulted in at least one fatality in a// cluster representing motor vehicle accidentsCount(Filter($aggregatedFeatures, "FATALITIES > 0"))The values returned from these expressions can be displayed in the cluster’s popupTemplate. To view the value in the popup, you must reference it in the expressionInfos property of the PopupTemplate and assign it a name and a title.
layer.featureReduction = { type: "cluster", popupTemplate: { expressionInfos: [ { name: "total-cost", title: "Total damages", expression: "Text($feature.cluster_count * $feature.cluster_avg_cost, '$#,###.##')", }, { name: "fatalities", title: "Crashes with fatalities", expression: ` Expects($aggregatedFeatures, 'FATALITIES') Count(Filter($aggregatedFeatures, 'FATALITIES > 0')) `, }, ], content: ` This cluster represents {cluster_count} motor vehical accidents. {expression/fatalities} of these crashes had at least one fatality. These crashes resulted in {expression/total-cost} of damages. `, },};Notice that once the expression exists in the expressionInfos property, you can reference the value returned from the expression using the {expression/expression-name} string template within the content of the PopupTemplate.
View the Clustering - filter popup features sample to see this profile in action.
Popup Element
- Specification: Popup Element profile
- Layer examples: Create popup charts from Arcade expressions
- Clustering examples: Popup charts for point clusters
The popup element profile allows map authors to write expressions that return a dictionary (i.e. an object) representing either a rich text, fields, or media (i.e. a chart) popup content element. The returned dictionary must follow the Web Map Specification for a popupElement. Unlike the Popup profile, this profile allows popup authors to return multiple values within a single element.
In this profile, expressions must return a dictionary, and may access a feature’s attributes with $feature, or data from other features and layers using $layer, $map, and $datastore.
This profile is useful in advanced scenarios where content in charts, tables, or rich text elements is based on logical conditions. For example, the following expression creates a fields content element containing only fields that have data values. This may be significantly more condensed than a standard FieldsContent element, which doesn’t give you the ability to check whether a field is empty.
// Creates a table with only fields that contain datavar fields = Schema($feature).fields;function getNames(field){  return field.name;}function filterValidFields(fieldName){  var invalidNames = ["objectid", "fid", "shape__area", "shape__length"];  return !includes(invalidNames, lower(fieldName)) && !IsEmpty($feature[fieldName]) && !IsNan($feature[fieldName]);}
var validFields = Filter(Map(fields, getNames), filterValidFields);var attributes = {};var fieldInfos = [];
for (var f in validFields){  var fieldName = validFields[f];  Push(fieldInfos, { fieldName: fieldName });  // format numbers with digit separator and one decimal place  var value = IIF(TypeOf($feature[fieldName] == "Number"), Text($feature[fieldName], "#,#.#"), $feature[fieldName]);  attributes[fieldName] = value;}
return {  type: "fields",  fieldInfos: fieldInfos,  attributes: attributes};
Popup element expressions are defined in the expressionInfo property of an ExpressionContent element.
// Creates an column chart where each category/value// is an aggregate of two or more fieldslayer.popupTemplate = {  title: "Educational Attainment",  content: [    {      type: "expression",      expressionInfo: {        expression: `        // Create a dictionary of attributes representing the values        // to display in the chart        var attributes = {          "No School": $feature.no_school + $feature.some_primary,          "Primary": $feature.primary_complete + $feature.some_secondary,          "Secondary": $feature.secondary_complete + $feature.some_highSchool,          "High School": $feature.highSchool_diploma + $feature.highSchool_ged + $feature.some_college,          "College/University": $feature.associates + $feature.bachelors + $feature.masters + $feature.doctorate + $feature.professional;        };
        var fields = [];
        // Create an array representing the attribute names (or keys)        for (var k in attributes){          Push(fields, k);        }
        // Returns a dictionary providing the information        // required by the popup to render a column chart        return {          type: "media",          attributes: attributes,          title: "Educational attainment",          mediaInfos: [{            type: "columnchart",            value: {              // The list of attribute names (keys) to include in the chart              fields: fields            }          }]        };      `,        title: "Educational Attainment",      },    },  ],};
You can also use this element to create charts or other content types consisting of aggregated data values. This can be especially useful in FeatureReductionCluster popups. The following examples describe the various content types you can define in an Arcade expression.
HTML List
This example demonstrates how to display an ordered list of values as a rich text element within a popup where all the values are derived from an Arcade expression. To create an ordered list, do the following in the Arcade expression:
- Use
GroupByto query the count of each fuel type within the cluster. - Order the types by their total count.
- Iterate through the types, and build an ordered HTML list displaying the type with the number of features.
- Return the list as a rich text element as defined by the popupElement specification.
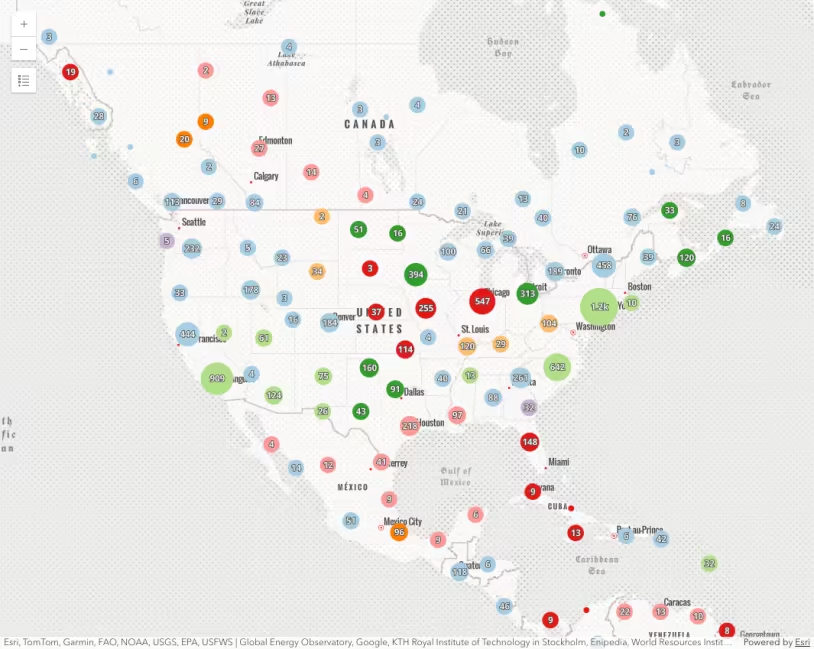
Global power plants. Click on a cluster to view a list of all types of fuel used to generate power within the cluster. Fuel types are displayed as a list ordered by count.
98 collapsed lines
<html> <head> <meta charset="utf-8" /> <meta name="viewport" content="width=device-width, initial-scale=1, shrink-to-fit=no" />
<title>Arcade Popup Element - HTML List</title>
<link rel="stylesheet" href="https://js.arcgis.com/5.1/esri/themes/light/main.css" /> <!-- Load the ArcGIS Maps SDK for JavaScript from CDN --> <script type="module" src="https://js.arcgis.com/5.1/"></script>
<style> html, body, #viewDiv { height: 100%; margin: 0; } </style>
<script type="module"> const [WebMap, MapView, FeatureLayer, Legend, Expand, clusterLabelCreator, reactiveUtils] = await $arcgis.import([ "@arcgis/core/WebMap.js", "@arcgis/core/views/MapView.js", "@arcgis/core/layers/FeatureLayer.js", "@arcgis/core/widgets/Legend.js", "@arcgis/core/widgets/Expand.js", "@arcgis/core/smartMapping/labels/clusters.js", "@arcgis/core/core/reactiveUtils.js", ]);
const layer = new FeatureLayer({ portalItem: { id: "eb54b44c65b846cca12914b87b315169", }, });
const map = new WebMap({ basemap: { portalItem: { id: "75a08e8cd8b64dcfa6945bb7f624ccc5", }, }, layers: [layer], });
const view = new MapView({ container: "viewDiv", map, extent: { spatialReference: { latestWkid: 3857, wkid: 102100, }, xmin: -15327459, ymin: 2740044, xmax: -6076744, ymax: 6878650, }, popup: { dockEnabled: true, dockOptions: { breakpoint: false, position: "top-right", }, }, });
view.ui.add( new Expand({ content: new Legend({ view }), view, }), "top-left", );
layer .when() .then(generateClusterConfig) .then(async (featureReduction) => { // sets generated cluster configuration on the layer layer.featureReduction = featureReduction;
// Disable clustering when user zooms beyond a 1:50,000 scale level // Re-enable clustering when the user zooms out to a scale smaller than 1:50,000 reactiveUtils.watch( () => view.scale, () => { layer.featureReduction = view.scale > 50000 ? featureReduction : null; }, ); }) .catch((error) => { console.error(error); });
async function generateClusterConfig(layer) {
let popupTemplate = { title: "Power plant summary", content: [ { type: "text", text: "The following list describes the number of power plants used to generate power for each fuel type in this cluster.", }, { type: "expression", expressionInfo: { expression: ` Expects($aggregatedFeatures, "fuel1")
var statsFS = GroupBy($aggregatedFeatures, [ { name: 'Type', expression: 'fuel1'}, ], [ // statistics to return for each fuel type { name: 'num_features', expression: '1', statistic: 'COUNT' } ] ); var ordered = OrderBy(statsFs, 'num_features DESC');
var list = "<ol>";
for (var group in ordered){ list += \`<li>\${group.Type} (\${Text(group.num_features, "#,###")})</li>\` } list += "</ol>";
return { type: "text", text: list } `, title: "Total Capacity List", }, }, ], };24 collapsed lines
// generates default labelingInfo const { labelingInfo, clusterMinSize } = await clusterLabelCreator .getLabelSchemes({ layer, view, }) .then((labelSchemes) => labelSchemes.primaryScheme);
return { type: "cluster", popupTemplate, labelingInfo, clusterMinSize, }; } </script> </head>
<body> <div id="viewDiv"></div> </body></html>Fields table
This example demonstrates how to display an ordered list of values as a fields popup element where all the values are derived from an Arcade expression. To create an fields element, do the following in the Arcade expression:
- Create an empty
fieldsInfosarray and an emptyattributesdictionary. Theattributesdictionary will contain the calculated values to display in the popup. - Use
GroupByto sum each fuel type’s power capacity within the cluster. - Order the types by their total capacity.
- Iterate through the types, and add each type as an attribute, setting its total capacity as the value of the attribute.
- Push the type to the
fieldsInfosarray. - Return the list as a fields content element as defined by the popupElement specification.
Global power plants. Click on a cluster to view a table of all types of fuel used to generate power within the cluster. Fuel types are displayed in order by their total mW capacity.
98 collapsed lines
<html> <head> <meta charset="utf-8" /> <meta name="viewport" content="width=device-width, initial-scale=1, shrink-to-fit=no" />
<title>Arcade Popup Element - fields</title>
<link rel="stylesheet" href="https://js.arcgis.com/5.1/esri/themes/light/main.css" /> <!-- Load the ArcGIS Maps SDK for JavaScript from CDN --> <script type="module" src="https://js.arcgis.com/5.1/"></script>
<style> html, body, #viewDiv { height: 100%; margin: 0; } </style>
<script type="module"> const [WebMap, MapView, FeatureLayer, Legend, Expand, clusterLabelCreator, reactiveUtils] = await $arcgis.import([ "@arcgis/core/WebMap.js", "@arcgis/core/views/MapView.js", "@arcgis/core/layers/FeatureLayer.js", "@arcgis/core/widgets/Legend.js", "@arcgis/core/widgets/Expand.js", "@arcgis/core/smartMapping/labels/clusters.js", "@arcgis/core/core/reactiveUtils.js", ]);
const layer = new FeatureLayer({ portalItem: { id: "eb54b44c65b846cca12914b87b315169", }, });
const map = new WebMap({ basemap: { portalItem: { id: "75a08e8cd8b64dcfa6945bb7f624ccc5", }, }, layers: [layer], });
const view = new MapView({ container: "viewDiv", map, extent: { spatialReference: { latestWkid: 3857, wkid: 102100, }, xmin: -15327459, ymin: 2740044, xmax: -6076744, ymax: 6878650, }, popup: { dockEnabled: true, dockOptions: { breakpoint: false, position: "top-right", }, }, });
view.ui.add( new Expand({ content: new Legend({ view }), view, }), "top-left", );
layer .when() .then(generateClusterConfig) .then(async (featureReduction) => { // sets generated cluster configuration on the layer layer.featureReduction = featureReduction;
// Disable clustering when user zooms beyond a 1:50,000 scale level // Re-enable clustering when the user zooms out to a scale smaller than 1:50,000 reactiveUtils.watch( () => view.scale, () => { layer.featureReduction = view.scale > 50000 ? featureReduction : null; }, ); }) .catch((error) => { console.error(error); });
async function generateClusterConfig(layer) {
let popupTemplate = { title: "Power plant summary", content: [ { type: "text", text: "The following table describes the total megawatt capacity of power plants used to generate power for each fuel type in this cluster.", }, { type: "expression", expressionInfo: { expression: ` Expects($aggregatedFeatures, "fuel1", "capacity_mw") var attributes = {}; var fieldInfos = [];
var statsFS = GroupBy($aggregatedFeatures, [ { name: 'Type', expression: 'fuel1'}, ], [ // statistics to return for each unique category { name: 'capacity_total', expression: 'capacity_mw', statistic: 'SUM' } ] ); var ordered = OrderBy(statsFs, 'capacity_total DESC');
for(var f in ordered){ var type = f.Type; attributes[type] = Text(f.capacity_total, "#,### mW"); Push(fieldInfos, { fieldName: type }); }
return { type: "fields", attributes: attributes, fieldInfos: fieldInfos, } `, title: "Table of fuel types", }, }, ], };24 collapsed lines
// generates default labelingInfo const { labelingInfo, clusterMinSize } = await clusterLabelCreator .getLabelSchemes({ layer, view, }) .then((labelSchemes) => labelSchemes.primaryScheme);
return { type: "cluster", popupTemplate, labelingInfo, clusterMinSize, }; } </script> </head>
<body> <div id="viewDiv"></div> </body></html>Pie chart
This example demonstrates how to create a pie chart as a media popup element where all the values of the pie chart are derived from an Arcade expression. To create a chart, do the following in the Arcade expression:
- Create an empty
fieldNamesarray and an emptyattributesdictionary. Theattributesdictionary will contain the values for each slice in the chart. - Use
Distinctto find each fuel type within the cluster. - Iterate through the types, and add each type as an attribute, setting its total count as the value of the attribute.
- Push the type to the
fieldNamesarray. - Return a dictionary defining a media content element as defined by the popupElement specification. This element must contain the attributes and a
piechartmediaInfo object containing the array offieldNamesto include in the chart.
Global power plants. Click on a cluster to view a pie chart visualizing the number of power plants for each fuel type within the cluster.
98 collapsed lines
<html> <head> <meta charset="utf-8" /> <meta name="viewport" content="width=device-width, initial-scale=1, shrink-to-fit=no" />
<title>Arcade Popup Element - Pie Chart</title>
<link rel="stylesheet" href="https://js.arcgis.com/5.1/esri/themes/light/main.css" /> <!-- Load the ArcGIS Maps SDK for JavaScript from CDN --> <script type="module" src="https://js.arcgis.com/5.1/"></script>
<style> html, body, #viewDiv { height: 100%; margin: 0; } </style>
<script type="module"> const [WebMap, MapView, FeatureLayer, Legend, Expand, clusterLabelCreator, reactiveUtils] = await $arcgis.import([ "@arcgis/core/WebMap.js", "@arcgis/core/views/MapView.js", "@arcgis/core/layers/FeatureLayer.js", "@arcgis/core/widgets/Legend.js", "@arcgis/core/widgets/Expand.js", "@arcgis/core/smartMapping/labels/clusters.js", "@arcgis/core/core/reactiveUtils.js", ]);
const layer = new FeatureLayer({ portalItem: { id: "eb54b44c65b846cca12914b87b315169", }, });
const map = new WebMap({ basemap: { portalItem: { id: "75a08e8cd8b64dcfa6945bb7f624ccc5", }, }, layers: [layer], });
const view = new MapView({ container: "viewDiv", map, extent: { spatialReference: { latestWkid: 3857, wkid: 102100, }, xmin: -15327459, ymin: 2740044, xmax: -6076744, ymax: 6878650, }, popup: { dockEnabled: true, dockOptions: { breakpoint: false, position: "top-right", }, }, });
view.ui.add( new Expand({ content: new Legend({ view }), view, }), "top-left", );
layer .when() .then(generateClusterConfig) .then(async (featureReduction) => { // sets generated cluster configuration on the layer layer.featureReduction = featureReduction;
// Disable clustering when user zooms beyond a 1:50,000 scale level // Re-enable clustering when the user zooms out to a scale smaller than 1:50,000 reactiveUtils.watch( () => view.scale, () => { layer.featureReduction = view.scale > 50000 ? featureReduction : null; }, ); }) .catch((error) => { console.error(error); });
async function generateClusterConfig(layer) {
let popupTemplate = { title: "Power plant summary", content: [ { type: "expression", expressionInfo: { expression: ` Expects($aggregatedFeatures, "fuel1") var attributes = {}; var fieldNames = [];
var types = Distinct($aggregatedFeatures, "fuel1");
for(var t in types){ var type = t.fuel1; Push(fieldNames, type); attributes[type] = Count(Filter($aggregatedFeatures, "fuel1 = @type" )); }
return { type: "media", attributes: attributes, title: "Total power plants", mediaInfos: [{ type: "piechart", value: { fields: fieldNames } }] } `, title: "Total Power Plants Pie Chart", }, }, ], };24 collapsed lines
// generates default labelingInfo const { labelingInfo, clusterMinSize } = await clusterLabelCreator .getLabelSchemes({ layer, view, }) .then((labelSchemes) => labelSchemes.primaryScheme);
return { type: "cluster", popupTemplate, labelingInfo, clusterMinSize, }; } </script> </head>
<body> <div id="viewDiv"></div> </body></html>Visualization
- Specification: Visualization profile
- Live examples: Create a custom visualization using Arcade
In the Visualization profile, Arcade allows you to calculate values for each feature in a layer at runtime and use those values for a data-driven visualization. This is an alternative approach to creating data-driven visualizations based on a single field in the layer. To accomplish this, an Arcade expression may be passed to the valueExpression property in a ClassBreaksRenderer, UniqueValueRenderer or any of the visual variables: color, size, opacity, and rotation instead of referencing a field/normalizationField. You can also use Arcade to override a CIMSymbol’s properties in the valueExpressionInfo.expression property of the symbol’s primitiveOverrides.
When used in a ClassBreaksRenderer or any of the visual variables, the expression may access a feature’s attributes with $feature and must evaluate to a number. Expressions may evaluate to either strings or numbers in UniqueValueRenderer.
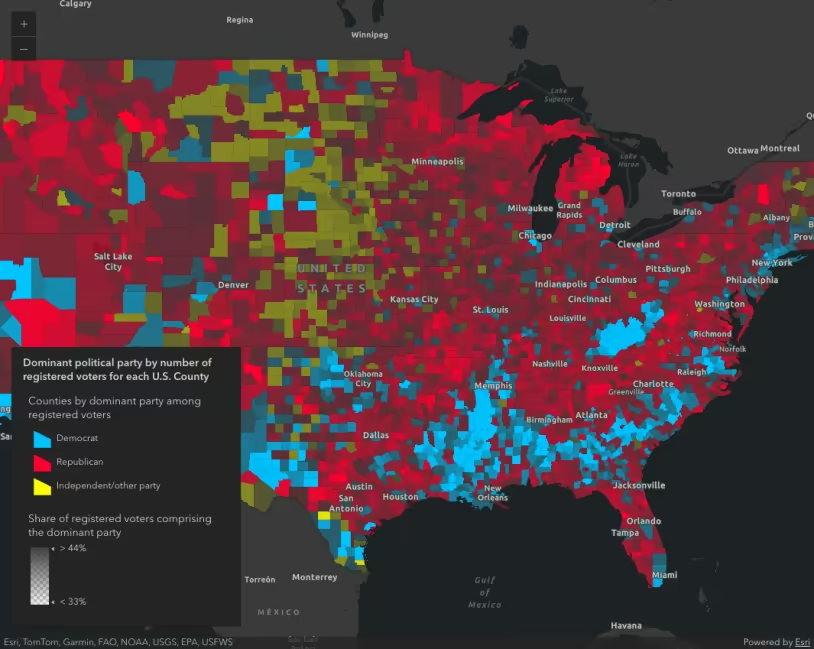
In the following snippet, a FeatureLayer representing U.S. counties is added to the map. The service has three fields that identify the number of republicans, democrats, and independent/non-party voters in each county. We can write an Arcade expression to color each county based on which party preference outnumbers the others.
First, write the Arcade expression in a script tag with a unique ID.
<script type="text/plain" id="winning-party">  // Write the expression and reference the value  // of each field with a meaningful variable name within  // the expression. Then calculate the max number with  // the Max() function and use Decode() to return a string  // value representing the party whose field value matches  // the max value.
  var republican = $feature.MP06025a_B;  var democrat = $feature.MP06024a_B;  var independent = $feature.MP06026a_B;  var parties = [republican, democrat, independent];  // Decode() and Max() are built-in Arcade functions  return Decode( Max(parties),    republican, 'republican',    democrat, 'democrat',    independent, 'independent',    'n/a');</script>
Then set the expression as a string value using document.getElementById() on the valueExpression property of a UniqueValueRenderer.
// Assign the expression to the `valueExpression` property and// set up the unique value infos based on the decode values// you set up in the expression.
const winnerArcade = document.getElementById("winning-party").text;
const renderer = new UniqueValueRenderer({  valueExpression: winnerArcade,  valueExpressionTitle: "Counties by dominant party among registered voters",  uniqueValueInfos: [    {      value: "democrat",      symbol: createSymbol("#00c3ff"),      label: "Democrat",    },    {      value: "republican",      symbol: createSymbol("#ff002e"),      label: "Republican",    },    {      value: "independent",      symbol: createSymbol("#faff00"),      label: "Independent/non-affiliated",    },  ],});
You can also add an opacity visual variable to the renderer to visualize the relative strength of the predominant party in each county. Counties where more people come from a single party will be drawn with high opacity, while those where the proportion of people from each party are relatively equal will be drawn with low opacity.
First, write the expression in a <script> tag.
<script type="text/plain" id="strength">  // Write the expression and reference the value  // of each field with a meaningful variable name within  // the expression. Then calculate the max number with  // the Max() function and the total using Sum().  // Calculate the share of the max population within the  // county. This value will be between 33 - 100 and will  // be used to determine the feature's opacity.  // Note the value is explicitly returned; it could also  // be implicitly returned like the previous example
  var republican = $feature.MP06025a_B;  var democrat = $feature.MP06024a_B;  var independent = $feature.MP06026a_B;  var parties = [republican, democrat, independent];  var total = Sum(parties);  var max = Max(parties);
  return (max / total) * 100;</script>
Then reference it in JavaScript as a string value.
// Assign the expression to the `valueExpression` property and// set up the unique value infos based on the decode values// you set up in the expression.
const strengthArcade = document.getElementById("strength").text;
const opacityVV = {  type: "opacity",  valueExpression: strengthArcade,  stops: [    { value: 33, opacity: 0.1 },    { value: 50, opacity: 1.0 },  ],};
// Add the visual variable to the renderer
renderer.visualVariables = [opacityVV];
View the Create a custom visualization using Arcade sample to see this example live.
Forms
Arcade is implemented in two form profiles:
- Form Constraint - For indicating whether a field should be visible, editable, or required in a form.
- Form Calculation - For calculating field values conditionally based on inputs from other fields.
Form Constraint
- Specification: Form Constraint profile
- Live examples: Advanced Attribute Editing, Update Feature Attributes
The Form Constraint profile is implemented in the FeatureForm component, allowing you to indicate whether fields are visible, required, or editable during editing workflows. For example, instead of displaying all of the specified fields in various field configurations, you can configure certain fields to display conditionally using a visibility Arcade expression. A visibility expression allows you to access a feature’s attributes with $feature and must return a Boolean value.
Expressions are defined in the expression property of an ExpressionInfo object. ExpressionInfos are set on the FormTemplate.expressionInfos property. To conditionally set the visibility of a form element, you must reference the expression name in the visibilityExpression property of the Element.
This profile is also implemented in the requiredExpression and editableExpression properties. These properties allow you to indicate whether a field is required or editable.
In the example below, the second field configuration displays a field labeled “Issue status”. The third field, resolution, will display if the value of status is Completed and the resolution field has a value.
const formTemplate = new FormTemplate({ title: "Inspector report", description: "Enter all relevant information below", elements: [ new FieldElement({ fieldName: "inspector", label: "Inspector name", }), new FieldElement({ fieldName: "status", label: "Issue status", }), new FieldElement({ fieldName: "resolution", label: "Resolution", // expression defined below visibilityExpression: "resolutionVisible", }), ], expressionInfos: [ { name: "resolutionVisible", title: "Resolution if status is completed", expression: "$feature.status == 'Completed' && !IsEmpty($feature.resolution)", }, ],});Form Calculation
- Specification: Form Calculation profile
The Form Calculation profile is implemented in the FeatureForm component, allowing you to calculate field values conditionally during editing workflows. You can access a feature’s attributes with $feature, attributes in the original feature ($originalFeature), and the edit type ($editcontext.editType). The expression must return a Text, Number, or a Date value.
Expressions are defined in the expression property of an ExpressionInfo object. ExpressionInfos are set on the FormTemplate.expressionInfos property. To conditionally calculate the value of a form element based on other form inputs, you must reference the expression name in the valueExpression property of the FieldElement.
In the example below, the first field is calculated based on the geometry of the feature. The last field, FullName, will be calculated based on the values of InspectorFirst and InspectorLast.
const formTemplate = new FormTemplate({ title: "Inspector report", description: "Enter all relevant information below", elements: [ new FieldElement({ fieldName: "Area", label: "Area (square meters)", // expression defined in expressionInfos valueExpression: "area" }), new FieldElement({ fieldName: "InspectorFirst", label: "First Name" }) new FieldElement({ fieldName: "InspectorLast", label: "Last Name" }) new FieldElement({ fieldName: "FullName", label: "Full Name", // expression defined in expressionInfos valueExpression: "fullName" }), ], expressionInfos: [{ name: "area", title: "Area (square meters)", expression: "Round(AreaGeodetic($feature, 'square-meters'), 2)" }, { name: "fullName", title: "Inspector full name", expression: ` IIF(!IsEmpty($feature.InspectorFirst) && !IsEmpty($feature.InspectorLast)){ return $feature.InspectorFirst + " " + $feature.InspectorLast; } ` }]});Feature sorting
- Specification: Feature Z profile
- Live examples: Configure feature sort order
In 2D MapViews you can use an Arcade expression to determine the sort order in which features should render in the view. Feature sorting is configured on the orderBy property of the FeatureLayer. Expressions for sorting feature drawing order must follow the Feature Z profile specification. They can reference attributes using $feature and must return a number or a date value.
// Orders features by storm warning duration in descending order.// Warnings with longer durations will be// rendered on top of warnings with shorter durations.layer.orderBy = [ { valueExpression: "DateDiff($feature.Watch_End, $feature.Watch_Start, 'hours' )", order: "descending", },];Z values
- Specification: Feature Z profile
- Live examples: Elevation options
In 3D SceneViews you can use Arcade expressions to set custom Z values on features. Although features can have Z values inside their geometry, you might want to calculate or replace them based on an attribute value, or derive it from a formula using the Z value. You may also have features that don’t contain Z values in their geometries, but have Z-related information stored in an attribute field. In these cases you can set an expression in the featureExpressionInfo.expression property. Expressions for overriding Z values must follow the Feature Z profile specification. They can reference attributes using $feature and must return a number. As an example, the Elevation options sample shows how to change the Z value of points using Arcade:
layer.elevationInfo = { mode: "absolute-height", featureExpressionInfo: { expression: "Geometry($feature).z + $feature.HEIGHT", }, unit: "meters",};In the example above, a field attribute HEIGHT is added to the Z value of the geometry to set the final graphic’s elevation. For polyline or polygon features, all the vertices of each feature will use the same Z value returned fromexpression.