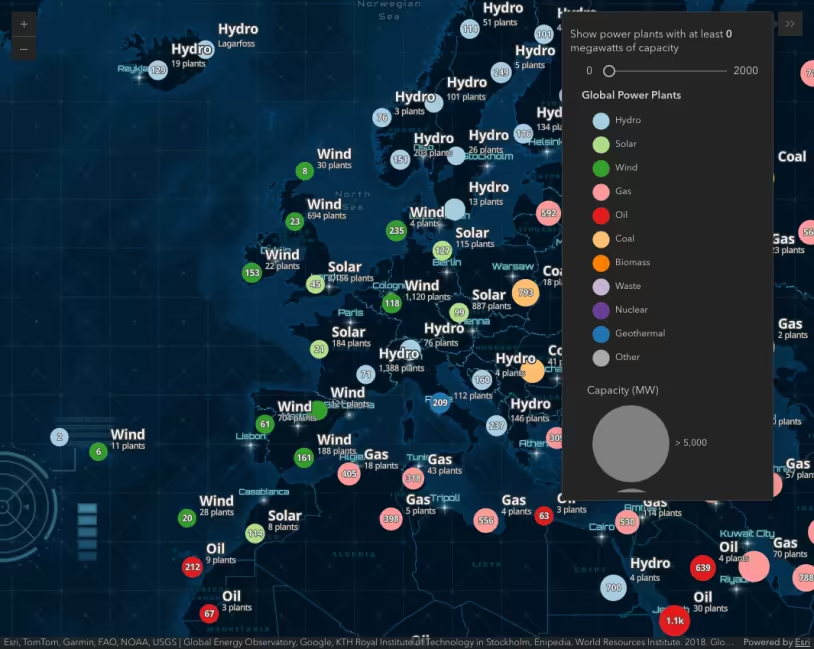
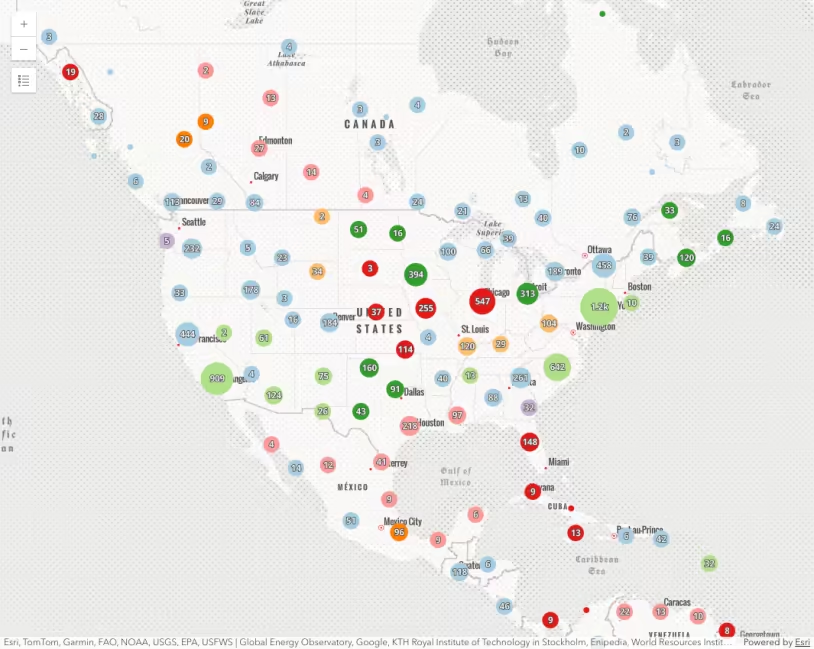
This sample demonstrates how to summarize clustered features by type using charts in a cluster’s popup. The app visualizes power plants as clusters. Each cluster’s popup displays a list of the five most common fuel types used to generate power within the cluster. It also includes two pie charts that summarize the number of power plants by fuel type and the total mW capacity for each fuel type within the cluster.
The list and charts are created using ExpressionContent popup elements, which can be used to conditionally build rich text, charts, or field lists with Arcade expressions. Expressions that return popup elements must return a dictionary representing the web map specification of the desired content element. The following popup elements are supported: TextContent, FieldsContent, and MediaContent.
Create an HTML list with Arcade
To return HTML from an Arcade expression, the HTML must be returned as a TextContent element. Expressions for building a text content element must return a dictionary matching the following specification:
return { type: "text", text: "<b>The text to display in the popup</b>"}Because TextContent can contain rich text, we can dynamically build HTML elements as a text value within an Arcade expression. Note that you cannot return HTML in Arcade in any other case, such as displaying an expression value from the PopupTemplate.expressionInfos property.
The following expression demonstrates how this works. Read the comments for details.
// Inform the popup, which fields the expression expects to use// to ensure they are downloaded to the clientExpects($aggregatedFeatures, "fuel1", "capacity_mw")
// Get the total number of features in the cluster// grouped by type and store it in a num_features fieldvar statsFS = GroupBy($aggregatedFeatures,  [    { name: 'Type', expression: 'fuel1'},  ],  [    { name: 'num_features', expression: '1', statistic: 'COUNT' }  ]);// Only return the top 5 results ordered by total featuresvar ordered = Top(OrderBy(statsFs, 'num_features DESC'), 5);
// create an HTML ordered list as a stringvar list = "<ol>";
// Create a new list item for each type in the top 5 'ordered' featuresetfor (var group in ordered){  list += \`<li>\${group.Type} (\${Text(group.num_features, "#,###")})</li>\`}list += "</ol>";
// return the list as rich textreturn {  type: "text",  text: list}
Create pie charts with Arcade
Expressions for charts must return a dictionary matching the web map specification of a MediaContent element:
return { type: "media", attributes: { field1: number, field2: number }, title: "Media content title", mediaInfos: [ { type: "piechart", // can also be "columnchart", "linechart", "piechart", "image" title: "Chart title", value: { // the list of attribute values to include in the chart fields: [ "field1", "field2" ], // optional array of RGBA color arrays to set custom chart colors colors: [[R,G,B],[R,G,B]] } } // you can define more charts here ]}When implemented in JavaScript, the charts can be defined with a list of field names. However, when dynamically creating charts with Arcade, you must create an attributes dictionary that stores key-value pairs containing the data to use in the chart. The keys are the field names to reference in the fields property of the chart value.
The following expression demonstrates how this works by creating two pie charts. Read the comments for details.
// Inform the popup, which fields the expression expects to use// to ensure they are downloaded to the client.Expects($aggregatedFeatures, "fuel1", "capacity_mw");// Create an object to store attributes// and arrays used to store field names for each chart.var attributes = {};var countFieldNames = [];var capacityFieldNames = [];// Create an array of the power plant types in the// order of the renderer.// Create an object of power plant types and// respective renderer colors.var rendererColors = {  Hydro: [166,206,227],  Solar: [178,223,138],  Wind: [51,160,44],  Gas: [251,154,153],  Oil: [227,26,28],  Coal: [253,191,111],  Biomass: [255,127,0],  Waste: [202,178,214],  Nuclear: [106,61,154],  Geothermal: [31,120,180]};
// Create an array to hold the custom chart colors.var chartColors = [];
// Get the distinct types of fuel within the cluster.// This can be an array of 1-12 types depending on the cluster.var types = Distinct($aggregatedFeatures, "fuel1");
// Add attributes to the dictionary for each type// one for the total count, the other for capacityfor(var t in types){  var type = t.fuel1;  // contains all the features belonging to the type  // on this iteration of the loop  var filtered = Filter($aggregatedFeatures, "fuel1 = @type");
  // Get the renderer color for the current type and if it doesn't exist,  // set the color to grey for "Other".  var color = iif(hasValue(rendererColors, type), rendererColors[type], [128,128,128,255]);
  // Create a field name for the count of the current type.  var countFieldName = type + " count";  // Store the total number of features in the attribute  attributes[countFieldName] = Count(filtered);
  // Repeat this process for the second chart.  var capacityFieldName = type + " capacity (mW)";  // Instead of count, get the sum for the capacity and add to attributes.  attributes[capacityFieldName] = DefaultValue(Sum(filtered, "capacity_mw"), 0);
  // Push the field names into the appropriate arrays.  Push(countFieldNames, countFieldName);  Push(capacityFieldNames, capacityFieldName);  // Push the chart color for the field into the chartColors array.  Push(chartColors, color);}
return {  type: "media",  // attributes for both charts here  attributes: attributes,  title: "Count vs. capacity comparison",  // list keys for attributes for each chart in "value"  mediaInfos: [{    type: "piechart",    title: "Total count",    value: {      fields: countFieldNames,      colors: chartColors    }  }, {    type: "piechart",    title: "Total capacity (mW)",    value: {      fields: capacityFieldNames,      colors: chartColors    }  }]}
The expressions are added directly to an ExpressionContent element within the popupTemplate content.
layer.featureReduction = { type: "cluster", popupTemplate: { title: "Power plant summary", content: [{ type: "expression", expressionInfo: "// list expression here", title: "List of fuel types" }, { type: "expression", expressionInfo: { expression: "// chart expression here" title: "Pie charts" } }] }};Related samples and resources
Intro to clustering
Clustering - generate suggested configuration
Clustering - filter popup features
Clustering - query clusters