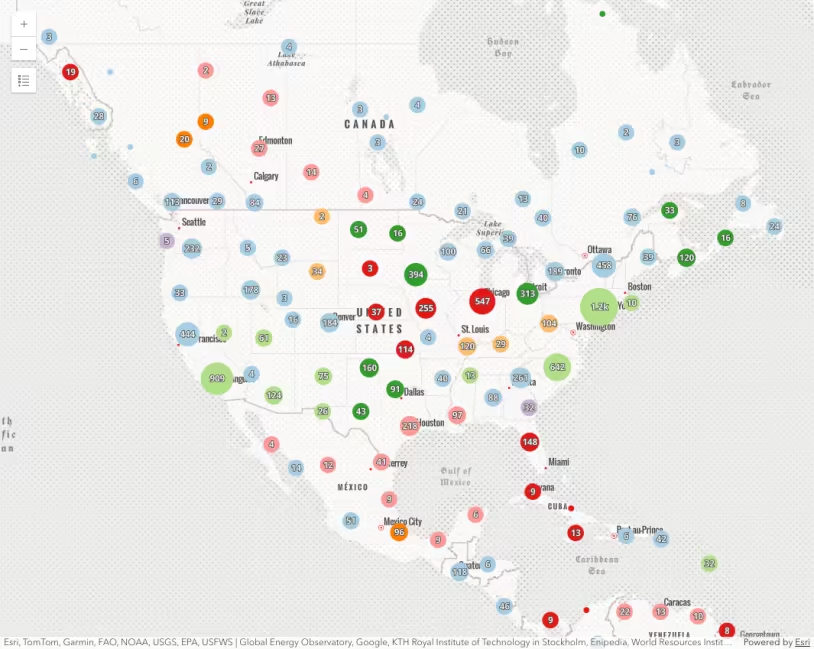
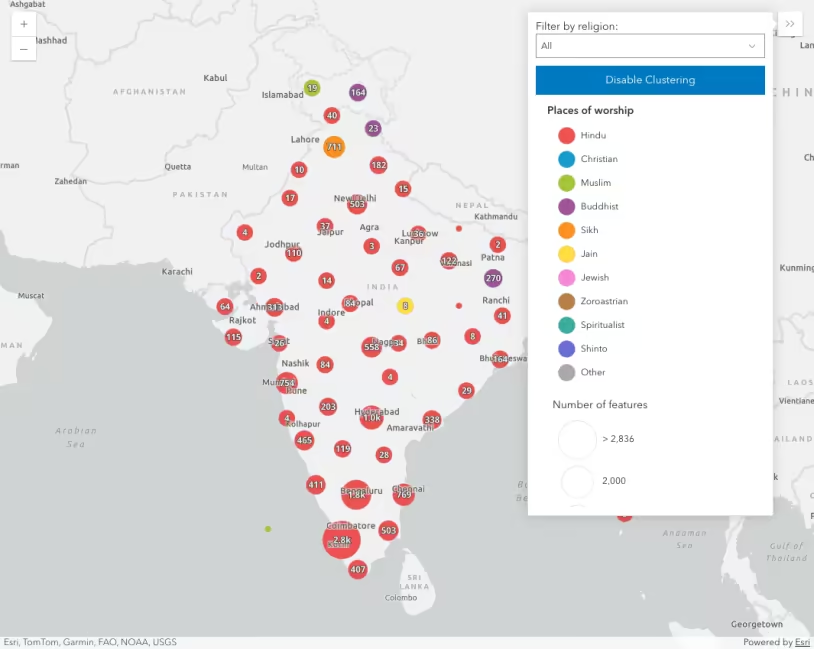
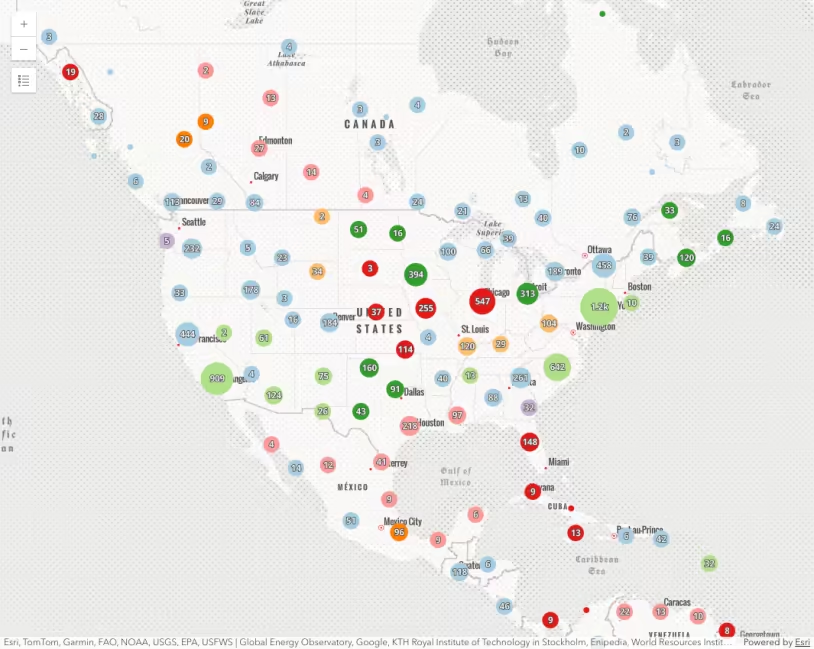
This sample demonstrates how to dynamically vary the size of clusters based on the sum of a numeric attribute, rather than the average (the default behavior).
This is done by creating an AggregateField using the sum statistic type and referencing that field in a SizeVariable of a renderer. This renderer must be set on the FeatureReductionCluster.renderer property.
Resize clusters by sum
const clusterConfig = { type: "cluster",
fields: [ { name: "population_total", alias: "Total population", onStatisticField: "POP", statisticType: "sum", }, ], renderer: { type: "simple", symbol: { type: "simple-marker", style: "circle", color: symbolColor, size: 24, outline: { color: outlineColor, width: 1, }, }, visualVariables: [ { type: "size", field: "population_total", stops: [ { value: 0, size: 8 }, { value: 100, size: 12 }, { value: 10000, size: 18 }, { value: 50000000, size: 48 }, ], }, ], },
clusterRadius: "120px", // {cluster_count} is an aggregate field containing // the number of features comprised by the cluster popupTemplate: { title: "Cluster summary", content: "This cluster represents {cluster_count} cities with a total population of <b>{population_total}</b>.", fieldInfos: [ { fieldName: "cluster_count", format: { places: 0, digitSeparator: true, }, }, { fieldName: "population_total", format: { places: 0, digitSeparator: true, }, }, ], }, labelingInfo: [ { deconflictionStrategy: "none", labelExpressionInfo: { expression: ` var value = $feature.population_total; var num = Count(Text(Round(value)));
if(value == 0){ return ""; } Decode(num, 4, Text(value / Pow(10, 3), "##.0k"), 5, Text(value / Pow(10, 3), "##k"), 6, Text(value / Pow(10, 3), "##k"), 7, Text(value / Pow(10, 6), "##m"), 8, Text(value / Pow(10, 6), "##m"), 9, Text(value / Pow(10, 6), "##m"), 10, Text(value / Pow(10, 6), "##m"), Text(value, "#,###") ) `, }, symbol: { type: "text", color: "white", font: { weight: "bold", family: "Noto Sans", size: "12px", }, haloColor: symbolColor, haloSize: 1, }, labelPlacement: "center-center", }, ], };Related samples and resources
Intro to clustering
Override cluster symbol
Clustering - filter popup features
Clustering - generate suggested configuration
Clustering - query clusters
Popup charts for clusters