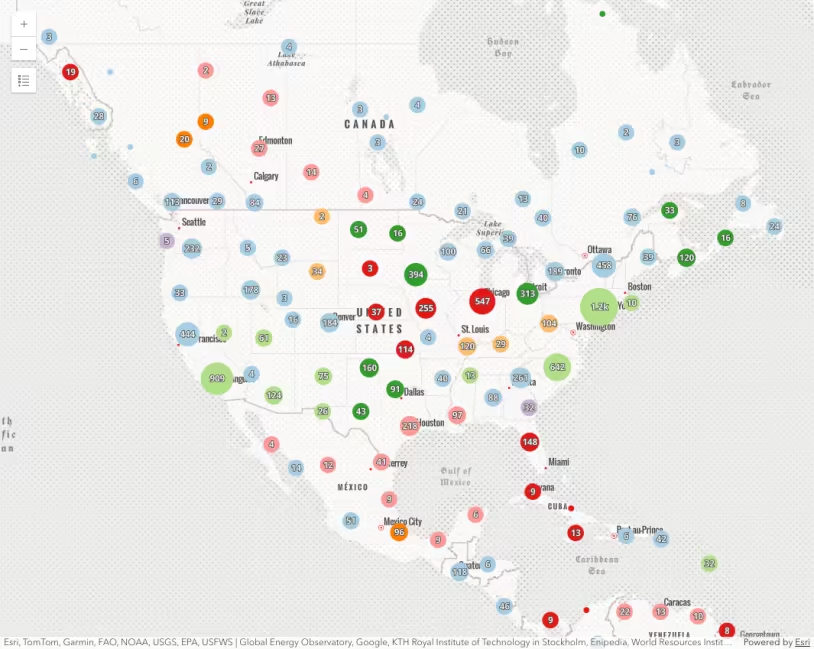
This sample demonstrates how to represent clusters as pie charts. This is done by calling the createRendererForClustering method in the pieChart smart mapping module.
This method returns a list of aggregate fields and a renderer. Both of these objects must be set on the FeatureReductionCluster object for the charts to properly render.
Configure clustering
async function generateClusterConfig(layer) { // generates default labelingInfo const { labelingInfo, clusterMinSize } = await clusterLabelCreator .getLabelSchemes({ layer, view: viewElement.view }) .then((labelSchemes) => labelSchemes.primaryScheme);
const labelSymbol = labelingInfo[0].symbol; labelSymbol.color = labelSymbol.haloColor.clone(); labelSymbol.haloColor = [255, 255, 255, 0.3]; labelSymbol.font.size = 10;
const { renderer, fields } = await pieChartRendererCreator.createRendererForClustering({ layer, shape: "donut", });
renderer.holePercentage = 0.66;
const fieldInfos = fields.map((field) => { return { fieldName: field.name, label: field.alias, format: { places: 0, digitSeparator: true, }, }; });
// maps the field names for the popup chart const fieldNames = fieldInfos.map((field) => { return field.fieldName; });
const popupTemplate = { content: [ { type: "text", text: "This cluster represents <b>{cluster_count}</b> features.", }, { type: "media", mediaInfos: [ { title: "311 Reports", type: "pie-chart", value: { fields: fieldNames, }, }, ], }, { type: "fields", }, ], fieldInfos, };
return { type: "cluster", popupTemplate, labelingInfo, clusterMinSize,
fields, renderer,
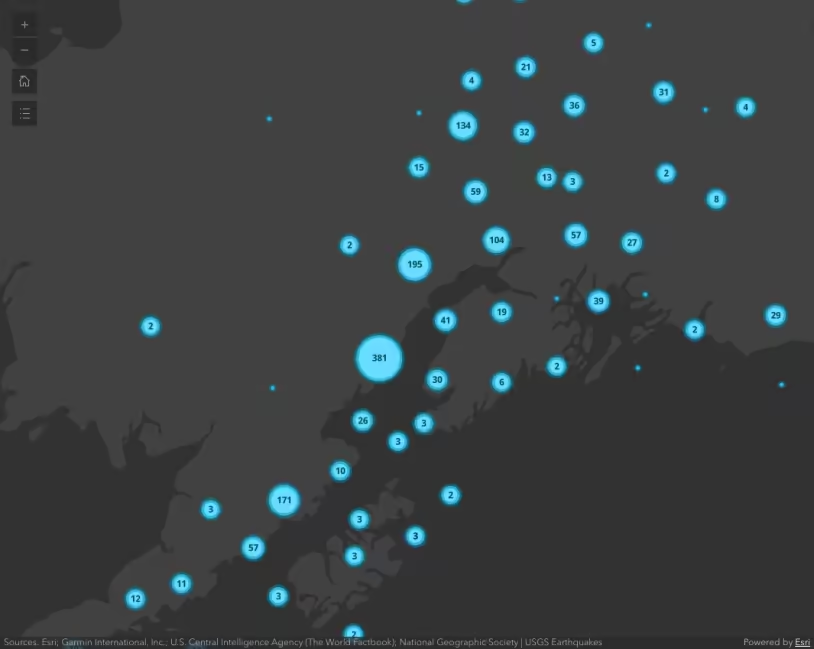
}; }Clustering is enabled via the featureReduction property of the FeatureLayer.
Set generated cluster configuration
await layer.when(); const featureReduction = await generateClusterConfig(layer); layer.featureReduction = featureReduction;Clustering is a method of aggregating features in a FeatureLayer, CSVLayer, GeoJSONLayer, WFSLayer, or OGCFeatureLayer by grouping them in clusters defined by screen space.
Related samples and resources
Intro to clustering
Override cluster symbol
Cluster size based on the sum of a field
Clustering - query clusters
Clustering - advanced configuration