Override cluster symbol

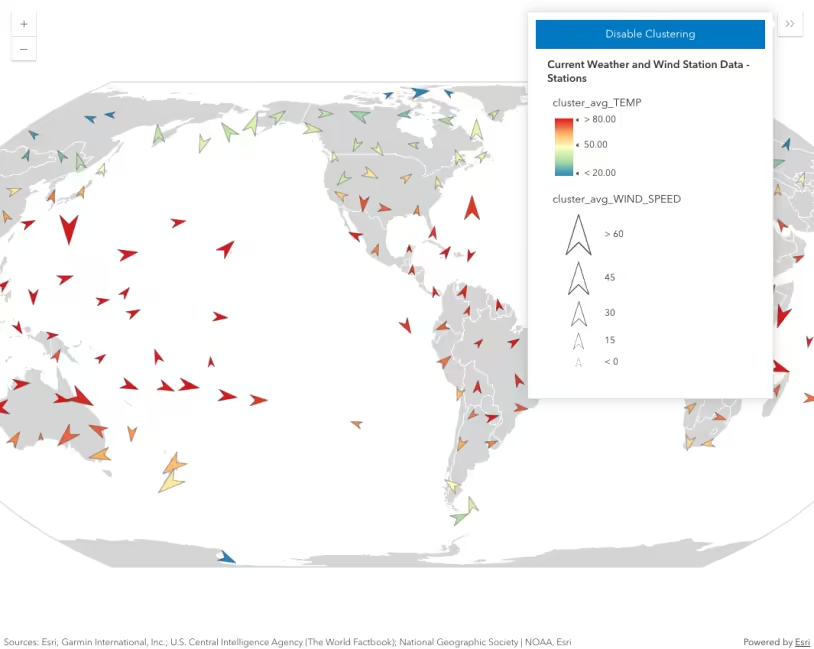
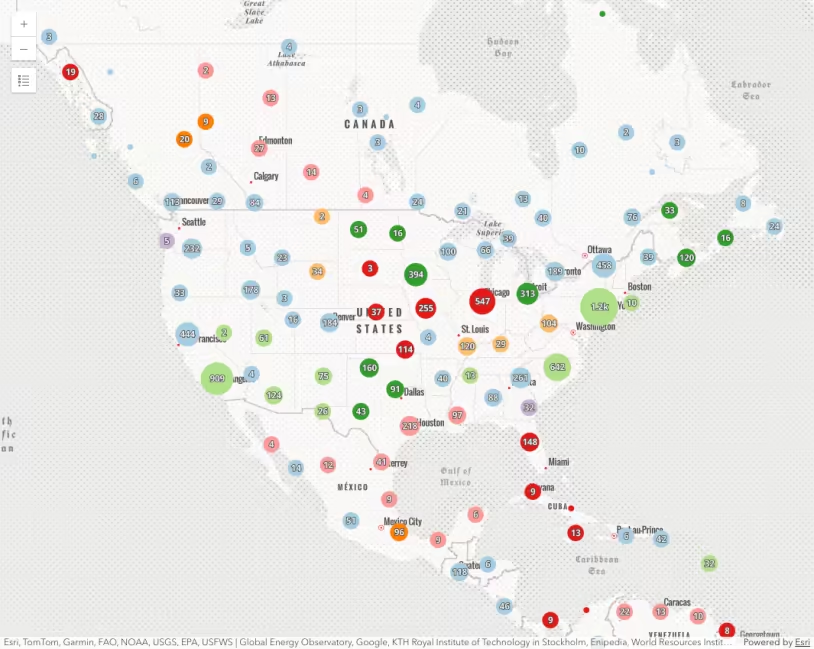
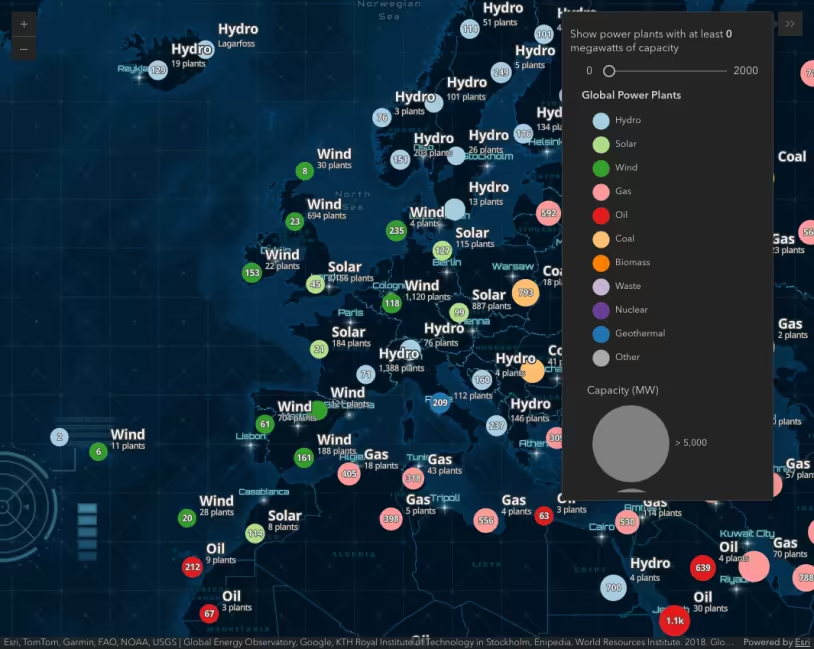
This sample demonstrates how to override the default cluster symbol when point clustering is enabled on a GeoJSONLayer. Clustering is a method of reducing points in a FeatureLayer, CSVLayer, GeoJSONLayer, WFSLayer, or OGCFeatureLayer by grouping them based on their spatial proximity to one another. Typically, clusters are proportionally sized based on the number of features within each cluster.

Clustering is configured in the featureReduction property of the layer. The feature reduction property gives you control over many cluster properties, including the cluster symbol. This allows you to retain the layer's renderer for styling individual features, but visually indicate clusters with a dedicated symbol.

Configure cluster symbol
Use dark colors for code blocksCopy
41 41 41 41 41 41 41 41 41 41 41 41 41 41 41 41 41 41 41 41 41 41 41 41 41 41 41 41 41 41 41 41 41 41 41 41 41 41 41 41 41 42 43 44 45 46 47 48 49 50 51 52 53 54 55 56 57 58 59 60 61 62 63 64 65 66 67 68 69 70 71 72 73 74 75 76 77 78 79 80 81 82 83 84 85 86 87 88 89 89 89 89 89 89 89 89 89 89 89 89 89 89 89 89 89 89 89 89 89 89 89 89 89 89 89 89 89 89 89 89 89 89 89 89 89 89 89 89 89 89 89 89 89 89 89 89 89 89 89 89 89 89 89 89 89 89 89 89 89 89 89 89 89 89 89 89 89 89 89 89 89 89 89 89 89 89 89 89 89 89 89 89 89 89 89 89 89 89 89 89 89 89 89 89 89 89 89 89 89 89 89 89 89 89 89 89 89 89 89 89 89 89 89 89 89 89 89 89 89 89 89 89 89 89 89 89 89 89 89 89 89 89 89 89
1
2
3
4
5
6
7
8
9
10
11
12
13
14
15
16
17
18
19
20
21
22
23
24
25
26
27
28
29
30
31
32
33
34
35
36
37
38
39
40
41
42
43
44
45
46
47
48
49
50
51
52
53
54
55
56
57
58
59
60
61
62
63
64
65
66
67
68
69
70
71
72
73
74
75
76
77
78
79
80
81
82
83
84
85
86
87
88
89
90
91
92
93
94
95
96
97
98
99
100
101
102
103
104
105
106
107
108
109
110
111
112
113
114
115
116
117
118
119
120
121
122
123
124
125
126
127
128
129
130
131
132
133
134
135
136
137
138
139
140
141
142
143
144
145
146
147
148
149
150
151
152
153
154
155
156
157
158
159
160
161
162
163
164
165
166
167
168
169
170
171
172
173
174
175
176
177
178
179
180
181
182
183
184
185
186
187
188
189
190
191
192
193
194
195
196
197
198
199
200
201
202
203
204
205
206
207
208
209
210
211
212
213
214
215
216
217
218
219
220
221
222
223
224
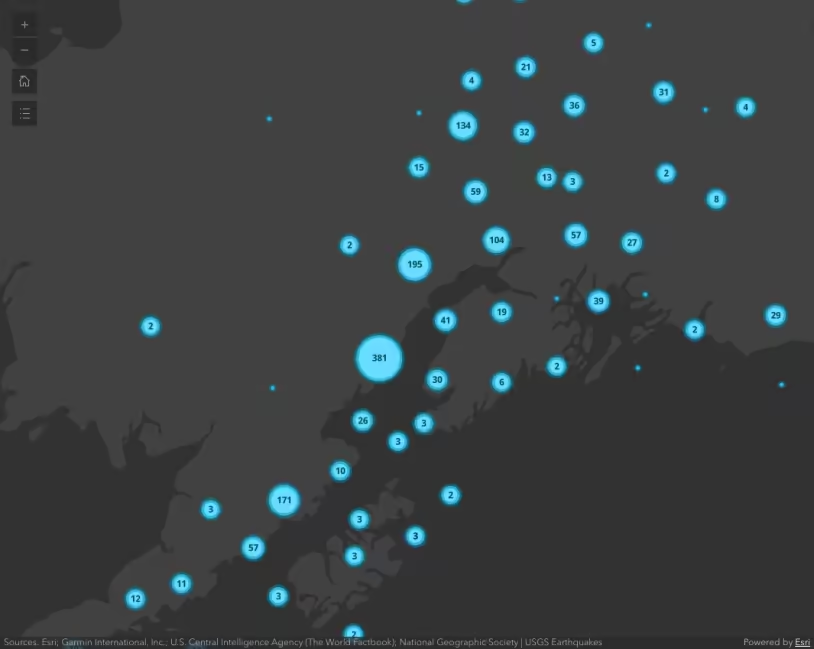
        const clusterConfig = {
          type: "cluster",
          clusterRadius: "100px",
          popupTemplate: {
            title: "Cluster summary",
            content: "This cluster represents {cluster_count} earthquakes.",
            fieldInfos: [
              {
                fieldName: "cluster_count",
                format: {
                  places: 0,
                  digitSeparator: true
                }
              }
            ]
          },
          clusterMinSize: "24px",
          clusterMaxSize: "60px",

          symbol: {
            type: "simple-marker",
            style: "circle",
            color: "#69dcff",
            outline: {
              color: "rgba(0, 139, 174, 0.5)",
              width: 6
            }
          },

          labelingInfo: [
            {
              deconflictionStrategy: "none",
              labelExpressionInfo: {
                expression: "Text($feature.cluster_count, '#,###')"
              },
              symbol: {
                type: "text",
                color: "#004a5d",
                font: {
                  weight: "bold",
                  family: "Noto Sans",
                  size: "12px"
                }
              },
              labelPlacement: "center-center"
            }
          ]
        };
Image preview of related sample Intro to clustering

Intro to clustering

Intro to clustering

Image preview of related sample Clustering - filter popup features

Clustering - filter popup features

This sample demonstrates how to filter clustered features within a cluster's popup.

Image preview of related sample Clustering - generate suggested configuration

Clustering - generate suggested configuration

Clustering - generate suggested configuration

Image preview of related sample Clustering - query clusters

Clustering - query clusters

Clustering - query clusters

Image preview of related sample Clustering - advanced configuration

Clustering - advanced configuration

Clustering - advanced configuration

Image preview of related sample Popup charts for point clusters

Popup charts for point clusters

This sample demonstrates how to summarize clustered features using charts within a cluster's popup.

Image preview of related sample Point clustering with visual variables

Point clustering with visual variables

Point clustering with visual variables

FeatureReductionCluster

Read the API Reference for more information.

Your browser is no longer supported. Please upgrade your browser for the best experience. See our browser deprecation post for more details.