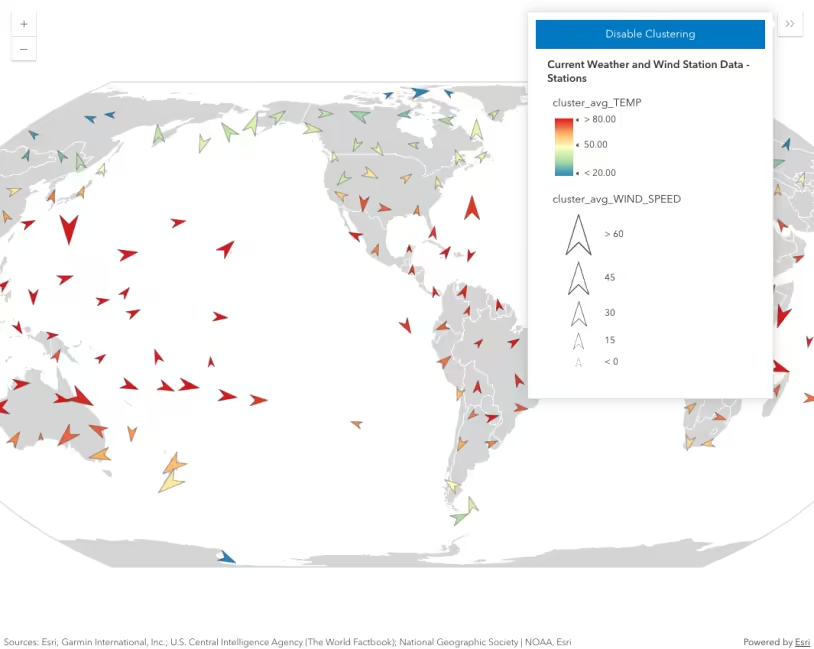
This sample demonstrates how to enable clustering on a GeoJSONLayer. Clustering is a method of reducing features in a FeatureLayer, CSVLayer, GeoJSONLayer, WFSLayer, or OGCFeatureLayer by grouping them based on their spatial proximity to one another. Typically, clusters are proportionally sized based on the number of features within each cluster.
Clustering is configured in the featureReduction property of the layer. You can enable clustering with a default configuration with minimal code by setting the type to cluster.
layer.featureReduction = { type: "cluster",};The feature reduction property gives you control over many other cluster properties. The clusterRadius defines area of influence that determines each cluster’s region for including features. You may also define popupTemplates and labels for clusters that summarize the features comprised by the cluster.
const clusterConfig = { type: "cluster", clusterRadius: "100px", // {cluster_count} is an aggregate field containing // the number of features comprised by the cluster popupTemplate: { title: "Cluster summary", content: "This cluster represents {cluster_count} earthquakes.", fieldInfos: [ { fieldName: "cluster_count", format: { places: 0, digitSeparator: true, }, }, ], }, clusterMinSize: "24px", clusterMaxSize: "60px", labelingInfo: [ { deconflictionStrategy: "none", labelExpressionInfo: { expression: "Text($feature.cluster_count, '#,###')", }, symbol: { type: "text", color: "#004a5d", font: { weight: "bold", family: "Noto Sans", size: "12px", }, }, labelPlacement: "center-center", }, ], };Suggestions for basic configuration
- Turn off label deconfliction when labeling clusters with a count in the center of the cluster. If label placement is outside the cluster, keep label deconfliction enabled.
- Increase the clusterMinSize to fit labels inside smaller clusters (16pt is a good starting point).
- For larger layers, format the cluster count in the label with either a rounded value or a meaningful abbreviated value (e.g.
10kinstead of10000). See the Clustering - generate suggested configuration for an example of this.
Clustering can only be configured in a MapView.
Related samples and resources
Clustering
Clustering - filter popup features
Clustering - generate suggested configuration
Clustering - query clusters
Clustering - advanced configuration
Popup charts for clusters