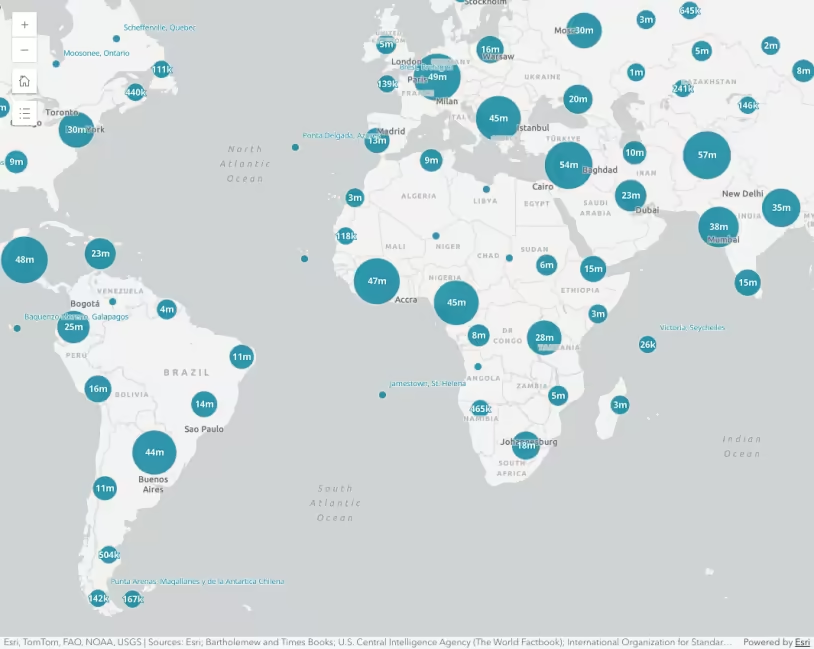
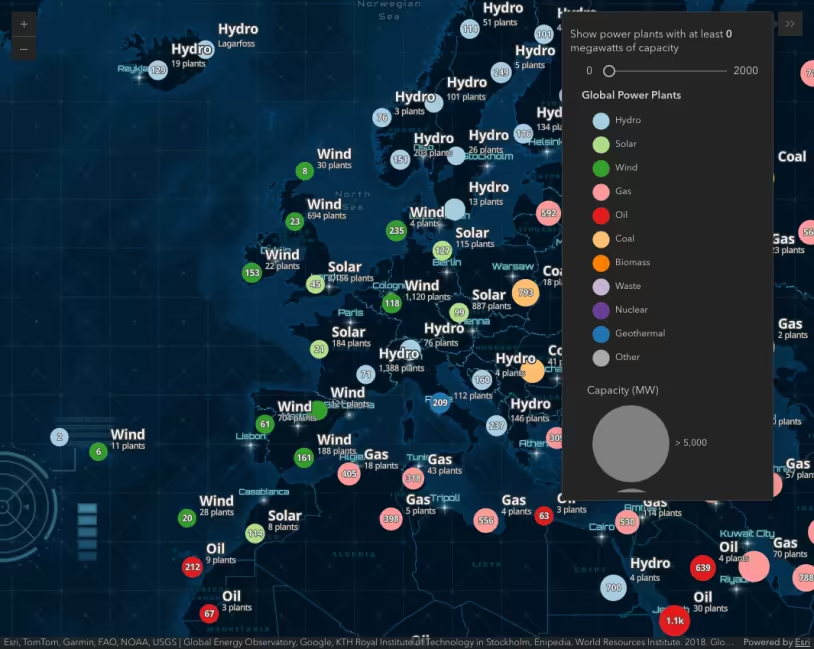
Global power plants clustered and categorized by fuel type. Clustering summarizes the layer’s renderer so you can see the spatial density of features at a glance.
What is clustering?
Clustering is a method of reducing features in a layer by grouping them into clusters based on their spatial proximity to one another. Typically, clusters are proportionally sized based on the number of features within each cluster.
This is an effective way to show areas where many points stack on top of one another.
Clustering allows you to effectively visualize where points stack on top of another or are in very close proximity to each other. Use the swipe widget above to compare an unclustered layer of power plants with a clustered version.
Why is clustering useful?
Large layers can be deceptive. What appears to be just a few features can in reality be several thousand. Clustering allows you to visually represent large numbers of features in relatively small areas.
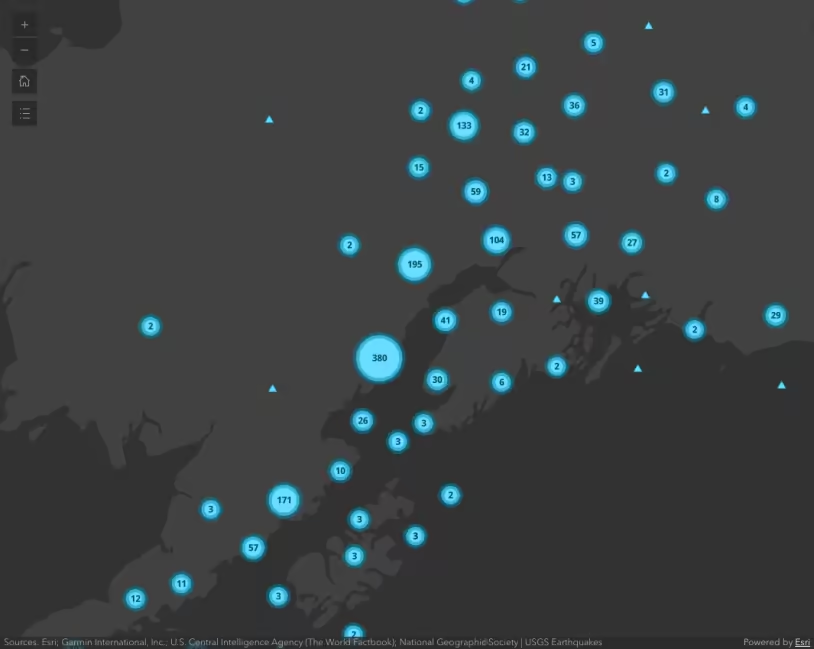
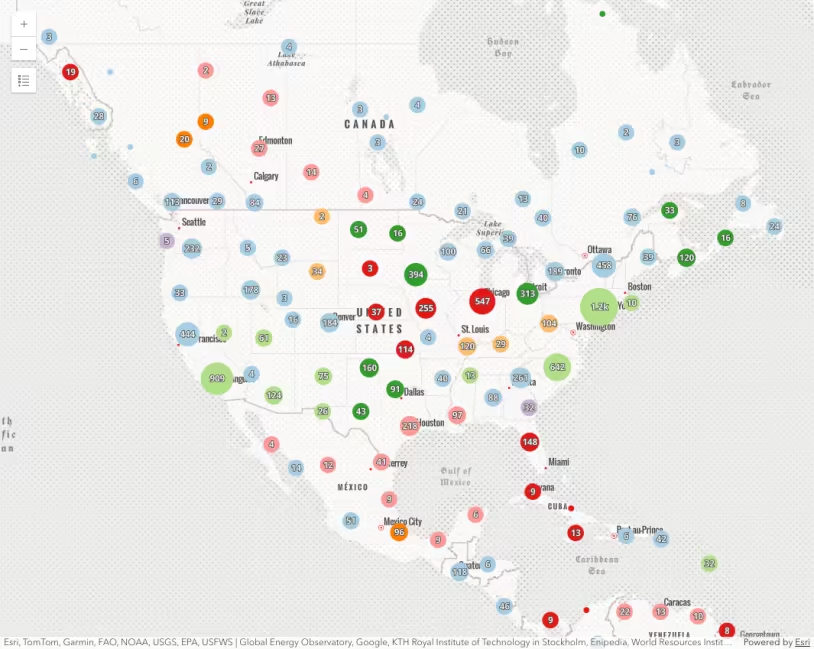
For example, the following map shows the locations of thousands of power plants. In the image below, regions A and B both have a high density of points, making them impossible to compare.
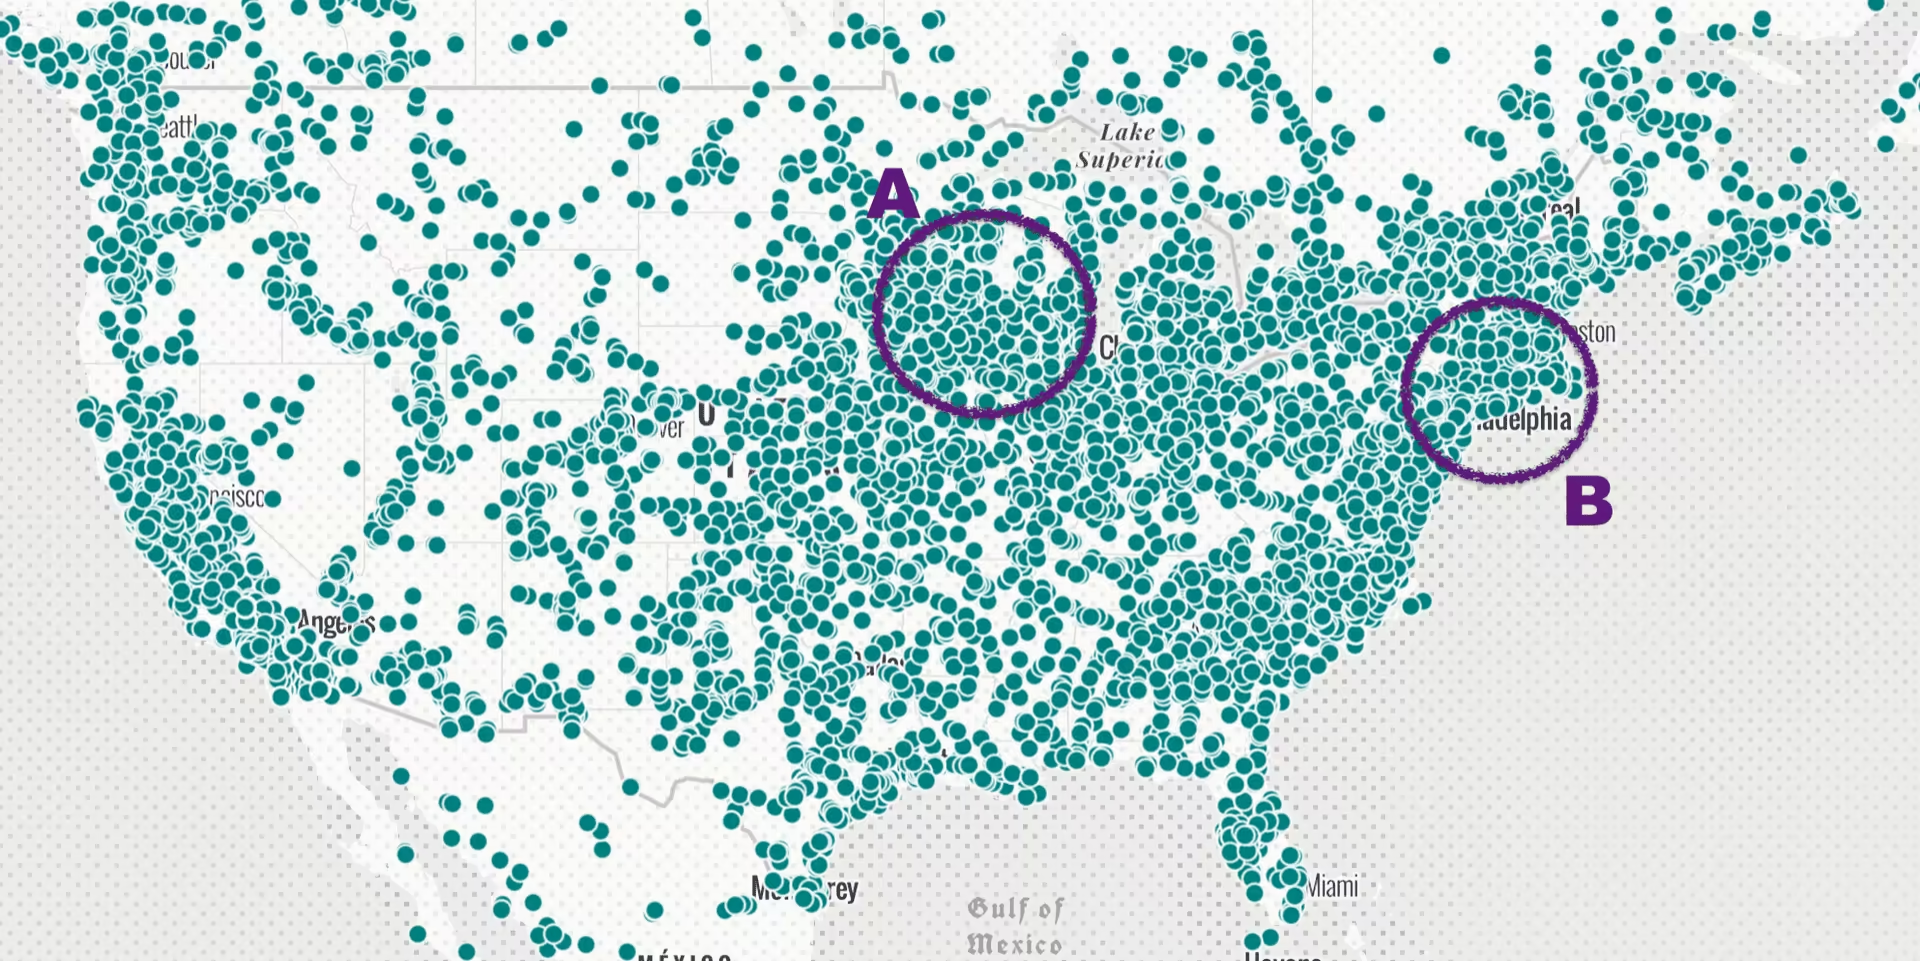
Region A and region B both have a high density of points. It is impossible to tell how many points overlap in each area.
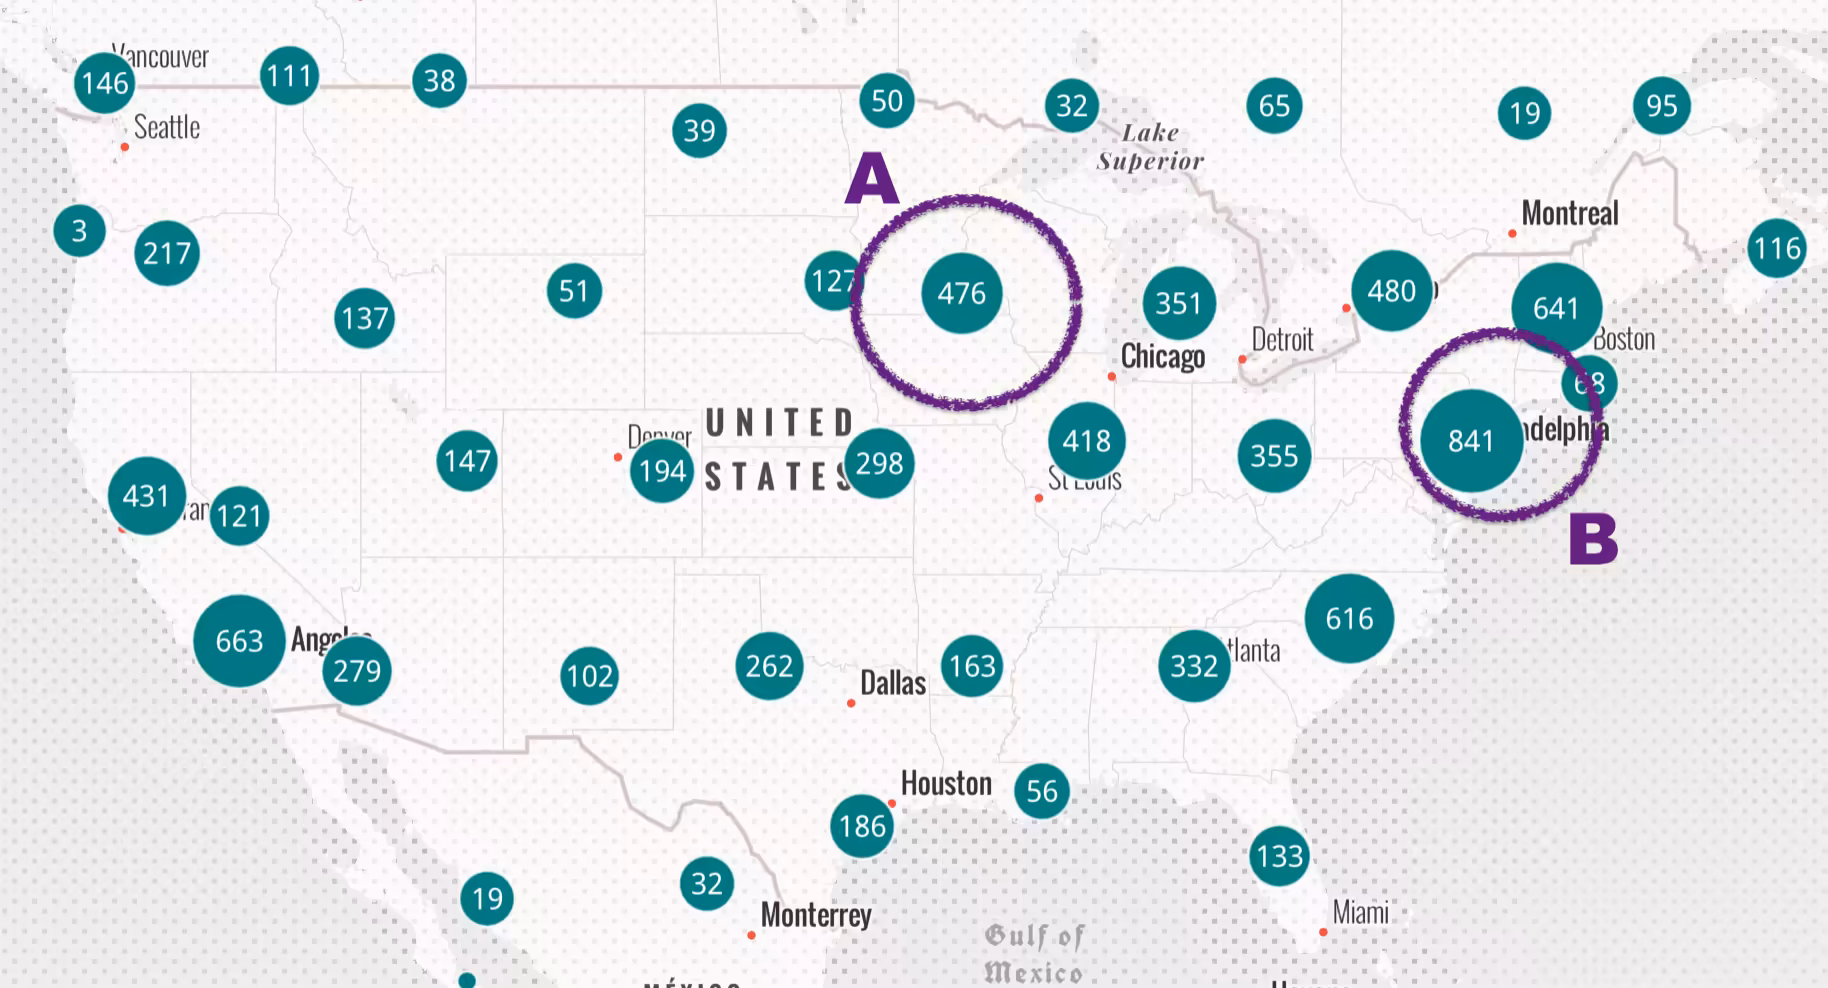
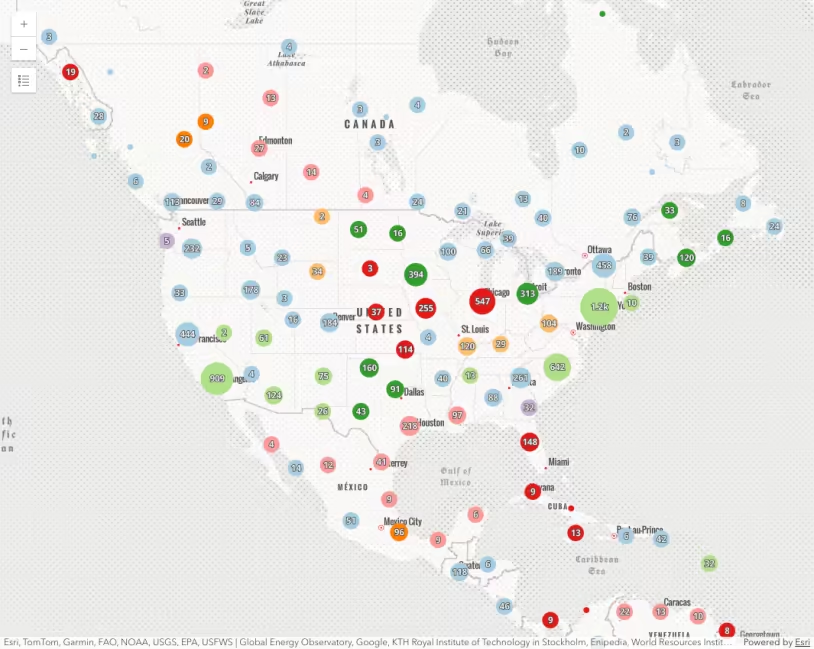
However, when clustering is enabled, the user can now clearly see that region B has nearly twice as many points as region A.
How clustering works
Clustering is configured on the featureReduction property of the layer. You can enable clustering with minimal code by setting the featureReduction type to cluster.
layer.featureReduction = { type: "cluster",};The featureReduction property gives you control over many other cluster properties. The clusterRadius defines each cluster’s area of influence for including features. You may also define popupTemplates and labels for clusters to summarize the features included in the cluster.
Clustering polylines and polygons
Clustering is typically used to visualize large point layers, but may be used with any geometry type (since version 4.31). In the case of clustering polyline or polygon features, the centroid of the line or polygon is used to determine the cluster in which it is placed. This may lead to some features being placed in unexpected clusters. Because of this, special considerations should be taken when clustering lines and polygons.
See the Clustered polygons sample for a good example of a clustered polygon layer.
Examples
Basic clustering
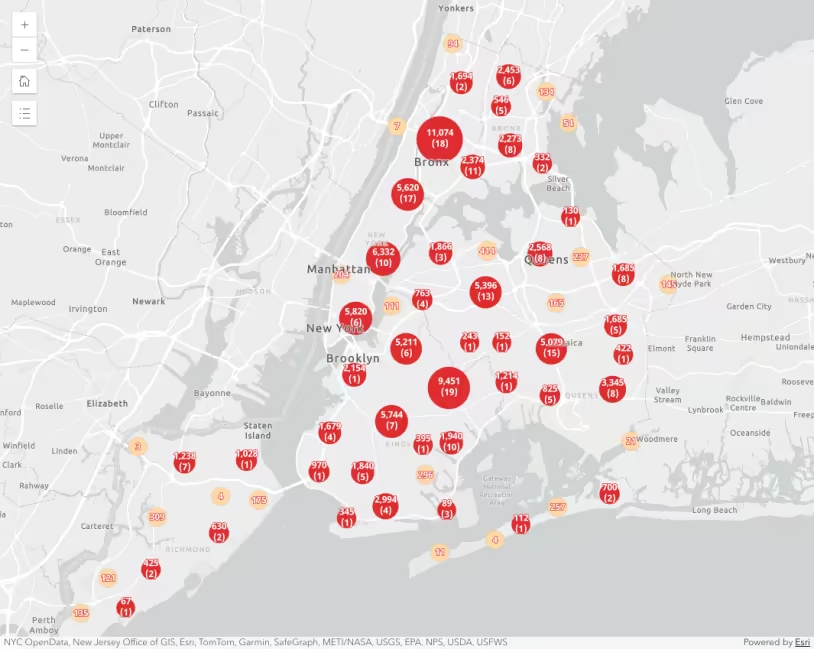
The following example demonstrates how to enable clustering and configure labels and a popup for displaying the cluster count.
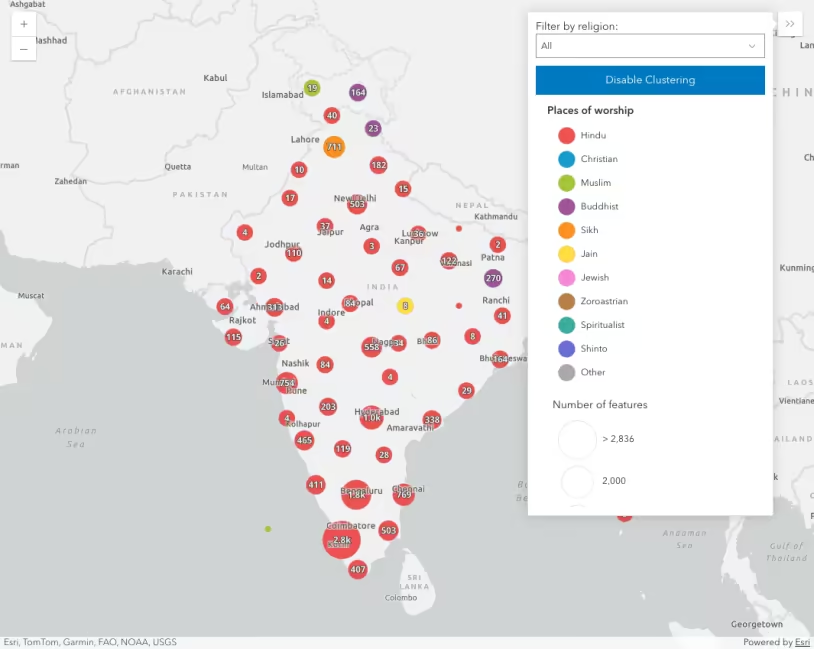
The aggregate fields used by clusters are generated once clustering is enabled on the layer. By default, all clustered layers have a cluster_count aggregate field. This can be used in the labels and the popup for each cluster. Other fields used in the layer’s renderer may be accessible for display in the popup. You can learn more about how to use these in the FeatureReductionCluster.popupTemplate documentation.
See the Related samples and resources below for more examples of how to summarize data within a cluster’s popup.
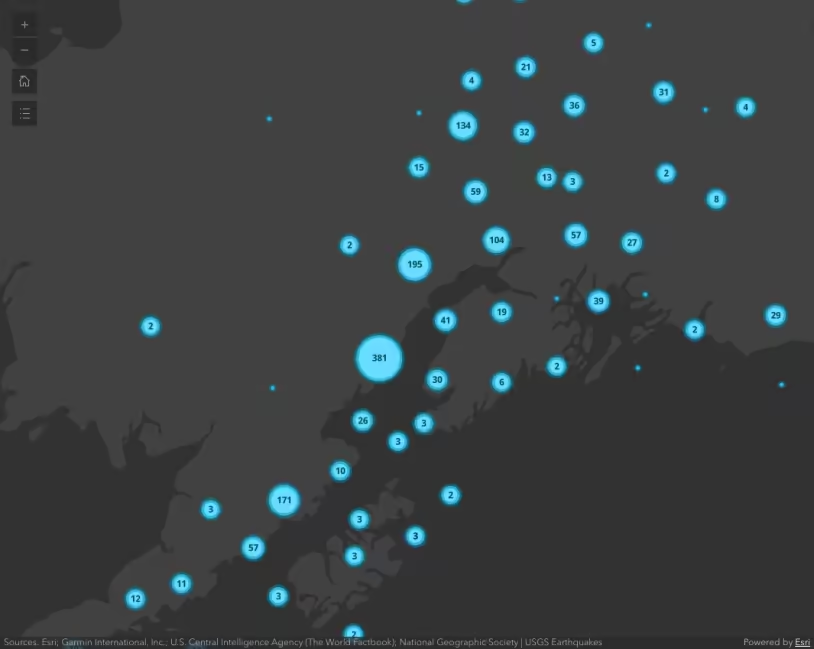
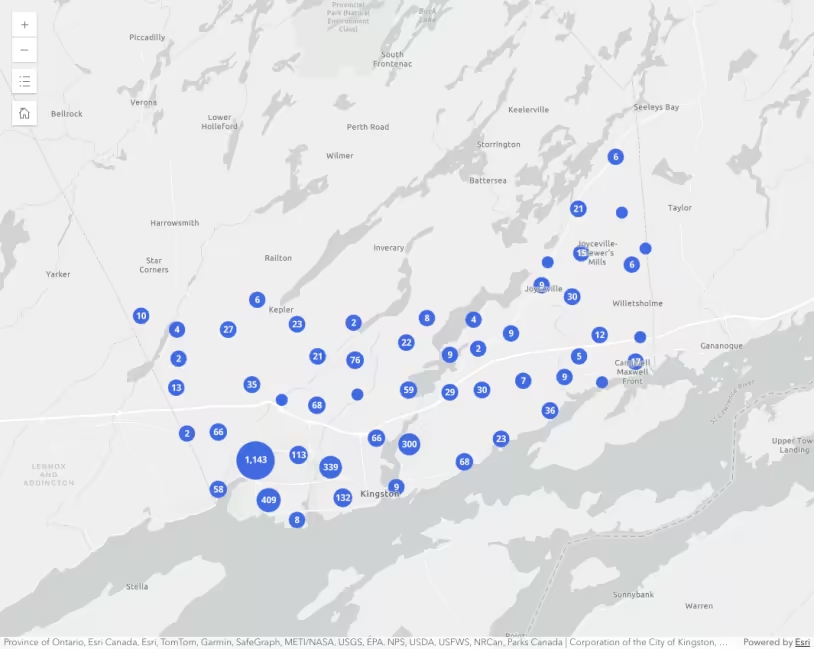
Clusters recalculate at each zoom level. Summary information can be displayed in labels and the popup.
36 collapsed lines
<html> <head> <meta charset="utf-8" /> <meta name="viewport" content="width=device-width, initial-scale=1, shrink-to-fit=no" /> <title>Intro to clustering</title>
<link rel="stylesheet" href="https://js.arcgis.com/5.1/esri/themes/light/main.css" /> <!-- Load the ArcGIS Maps SDK for JavaScript from CDN --> <script type="module" src="https://js.arcgis.com/5.1/"></script>
<script type="module"> const [WebMap, MapView, FeatureLayer] = await $arcgis.import([ "@arcgis/core/WebMap.js", "@arcgis/core/views/MapView.js", "@arcgis/core/layers/FeatureLayer.js", ]);
const clusteredLayer = new FeatureLayer({ portalItem: { id: "eb54b44c65b846cca12914b87b315169", }, renderer: { type: "simple", symbol: { type: "simple-marker", size: 6, color: "teal", outline: { color: "white", width: 0.5, }, }, }, });
clusteredLayer.featureReduction = { type: "cluster", clusterMinSize: 16.5, // defines the label within each cluster labelingInfo: [ { deconflictionStrategy: "none", labelExpressionInfo: { expression: "Text($feature.cluster_count, '#,###')", }, symbol: { type: "text", color: "white", font: { family: "Noto Sans", size: "12px", }, }, labelPlacement: "center-center", }, ], // information to display when the user clicks a cluster popupTemplate: { title: "Cluster Summary", content: "This cluster represents <b>{cluster_count}</b> features.", fieldInfos: [ { fieldName: "cluster_count", format: { places: 0, digitSeparator: true, }, }, ], }, };52 collapsed lines
const map = new WebMap({ basemap: { portalItem: { id: "75a08e8cd8b64dcfa6945bb7f624ccc5", }, }, layers: [clusteredLayer], });
const view = new MapView({ container: "viewDiv", map, extent: { spatialReference: { latestWkid: 3857, wkid: 102100, }, xmin: -15327459, ymin: 2740044, xmax: -6076744, ymax: 6878650, }, popup: { dockEnabled: true, dockOptions: { breakpoint: false, position: "top-right", }, }, constraints: { snapToZoom: false, }, }); </script>
<style> html, body, #viewDiv { background-color: white; height: 100%; margin: 0; } </style> </head>
<body> <div id="viewDiv"></div> </body></html>Suggested cluster defaults
By default, the cluster symbol always summarizes the features in the cluster. When a layer has a UniqueValueRenderer, the symbol of each cluster represents the predominant value of features in the cluster. When a layer has any visual variables applied to it, the average of each variable in the cluster is applied to the cluster symbol. The fields describing the predominant type and average of numeric fields can be referenced in the cluster popup and label.
This example uses smart mapping methods to demonstrate how to generate the suggested cluster configuration specific to the layer’s renderer.
Global power plants clustered and categorized by fuel type. Clustering summarizes the layer renderer so you can see a summary of the features contained by the cluster at a glance.
83 collapsed lines
<html> <head> <meta charset="utf-8" /> <meta name="viewport" content="width=device-width, initial-scale=1, shrink-to-fit=no" /> <title>Clustering - unique values</title>
<link rel="stylesheet" href="https://js.arcgis.com/5.1/esri/themes/light/main.css" /> <!-- Load the ArcGIS Maps SDK for JavaScript from CDN --> <script type="module" src="https://js.arcgis.com/5.1/"></script>
<script type="module"> const [WebMap, MapView, FeatureLayer, Legend, Expand, clusterLabelCreator, clusterPopupCreator] = await $arcgis.import([ "@arcgis/core/WebMap.js", "@arcgis/core/views/MapView.js", "@arcgis/core/layers/FeatureLayer.js", "@arcgis/core/widgets/Legend.js", "@arcgis/core/widgets/Expand.js", "@arcgis/core/smartMapping/labels/clusters.js", "@arcgis/core/smartMapping/popup/clusters.js", ]);
const layer = new FeatureLayer({ portalItem: { id: "eb54b44c65b846cca12914b87b315169", }, });
const map = new WebMap({ basemap: { portalItem: { id: "75a08e8cd8b64dcfa6945bb7f624ccc5", }, }, layers: [layer], });
const view = new MapView({ container: "viewDiv", map, extent: { spatialReference: { latestWkid: 3857, wkid: 102100, }, xmin: -15327459, ymin: 2740044, xmax: -6076744, ymax: 6878650, }, popup: { dockEnabled: true, dockOptions: { breakpoint: false, position: "top-right", }, }, constraints: { snapToZoom: false, }, });
view.ui.add( new Expand({ content: new Legend({ view }), view, }), "top-left", );
layer .when() .then(generateClusterConfig) .then((featureReduction) => { // sets generated cluster configuration on the layer layer.featureReduction = featureReduction; }) .catch((error) => { console.error(error); });
async function generateClusterConfig(layer) {
// generates default popupTemplate const popupTemplate = await clusterPopupCreator .getTemplates({ layer }) .then((popupTemplateResponse) => popupTemplateResponse.primaryTemplate.value);
// generates default labelingInfo const { labelingInfo, clusterMinSize } = await clusterLabelCreator .getLabelSchemes({ layer, view, }) .then((labelSchemes) => labelSchemes.primaryScheme);
// Set this object on layer.featureReduction return { type: "cluster", popupTemplate, labelingInfo, clusterMinSize, };19 collapsed lines
} </script>
<style> html, body, #viewDiv { background-color: white; height: 100%; margin: 0; } </style> </head>
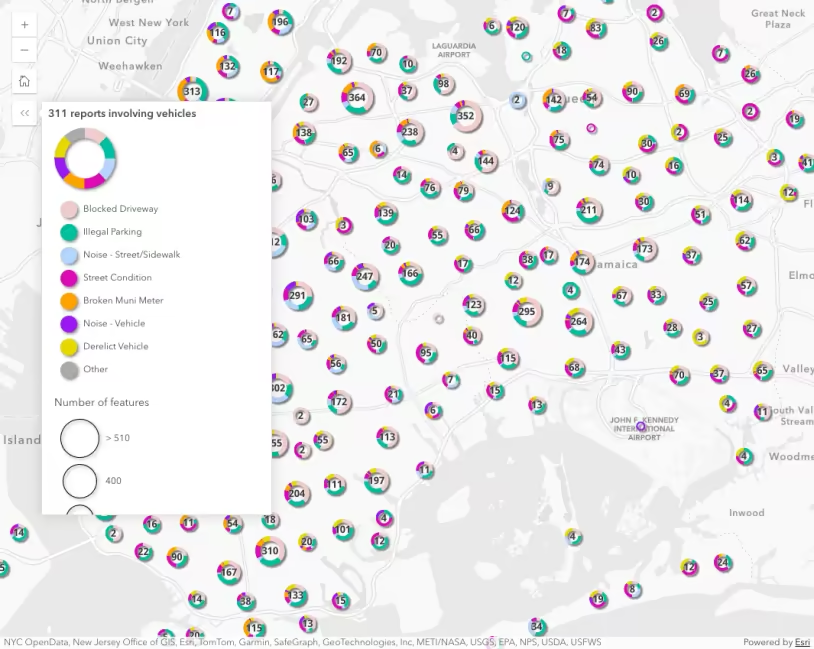
<body> <div id="viewDiv"></div> </body></html>Clusters as pie charts
By default, when a layer has a UniqueValueRenderer or ClassBreaksRenderer, the symbol of each cluster represents the predominant category within the cluster.
You may prefer to visualize clusters of type-based renderers as pie charts rather than the predominant category. To do this, you can call the pieChart.createRendererForClustering method, which will create a pie chart renderer based on the categories defined in a UniqueValueRenderer or a ClassBreaksRenderer.
The fields and renderer returned from this method should be set directly on the FeatureReductionCluster instance on the layer.
const { renderer, fields } = await pieChartRendererCreator.createRendererForClustering({  layer,  shape: "donut",});
layer.featureReduction = {  type: "cluster",  fields,  renderer,};
311 incident reports categorized by fuel type. Clustering summarizes the layer renderer as a pie chart for layers with a UniqueValueRenderer or ClassBreaksRenderer.
Related samples and resources
Intro to clustering
Clustered polygons
Override cluster symbol
Clusters as pie charts
Cluster size based on the sum of a field
Clustering with aggregate fields
Clustering - generate suggested configuration
Clustering - filter popup features
Clustering - query clusters
Clustering - advanced configuration
Clustering with visual variables
FeatureReductionCluster
API support
The following table describes the geometry and view types that are suited well for each visualization technique.
| 2D | 3D | Points | Lines | Polygons | Mesh | Client-side | Server-side | |
|---|---|---|---|---|---|---|---|---|
| | | | | | | | | |
| | | | | | | | | |
| | | | | | | | | |
| | | | | | | | | |
| | | | | | | | | |
| | | | | | | | | |
| | | | ||||||
| | | | | | | | |
- Feature reduction selection not supported
- Only by feature reduction selection
- Only by scale-driven filter