What is a unique types style?
A unique types style assigns distinct symbols to unique data values returned from a field or expression in a layer. You can use this style to visualize what something represents, such as:
- Show points of interest on a map (e.g. schools, parks, places of worship)
- Represent categories of data (e.g. regions, types)
- Visualize ordinal data (e.g. high, medium, and low)
How a unique types style works
This style is configured with a Unique Value Renderer. This renderer requires the following:
- A reference to a data value either from a field name, or an Arcade expression.
- A list of unique value infos that match a unique symbol with an expected value returned from the field or expression.
Examples
Categorical data
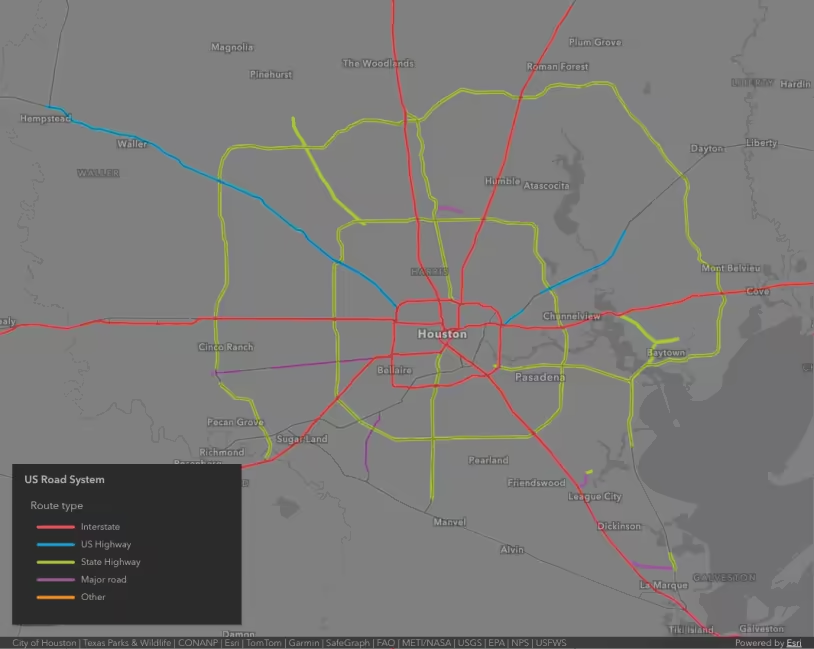
This example demonstrates how to visualize categories using a string attribute value. The app visualizes freeways based on their classification: interstate, state highway, or U.S. highway.
- Create a Unique Value Renderer
A unique value renderer is a renderer that defines a distinct symbol for each unique data value returned from a field or expression in a layer. . - Reference the field name containing the classification values.
- Create unique value info objects and assign a symbol to each expected value.
- You can optionally add a default symbol to represent all features that don’t have a matching value.
35 collapsed lines
<!doctype html><html> <head> <meta charset="utf-8" /> <meta name="viewport" content="width=device-width, initial-scale=1, shrink-to-fit=no" /> <title>Esri Developer Guide: Unique types</title>
<!-- Load the ArcGIS Maps SDK for JavaScript from CDN --> <script type="module" src="https://js.arcgis.com/5.1/"></script>
<style> html, body { height: 100%; margin: 0; } </style> </head>
<body class="calcite-mode-dark"> <arcgis-map item-id="625fed092fb14fdbb3f79089284b383a" center="-93.20, 44.91" scale="577790"> <arcgis-legend slot="bottom-left"></arcgis-legend> </arcgis-map>
<script type="module"> const FeatureLayer = await $arcgis.import("@arcgis/core/layers/FeatureLayer.js");
const viewElement = document.querySelector("arcgis-map"); await viewElement.viewOnReady(); viewElement.constraints.snapToZoom = false;
// Configure the base symbol style and color ramp for road types. const init = { type: "simple-line", style: "solid", width: "4px" }; const colors = ["#dc4b00", "#3c6ccc", "#d9dc00", "#91d900", "#986ba1"];
// Color and label each feature based on its matching field value. const renderer = { type: "unique-value", // autocasts as new UniqueValueRenderer() field: "RTTYP", // Treat features based on their route type code. defaultLabel: "Other", defaultSymbol: { ...init, color: colors[4] }, // The colors and labels defined here will reflect in the legend. uniqueValueInfos: [ { label: "Interstate", symbol: { ...init, color: colors[0] }, value: "I" }, { label: "US Highway", symbol: { ...init, color: colors[1] }, value: "U" }, { label: "State Highway", symbol: { ...init, color: colors[2] }, value: "S" }, { label: "Major road", symbol: { ...init, color: colors[3] }, value: "M" }, ], legendOptions: { title: "Route type" }, // Define feature draw order by class position in uniqueValueInfos. orderByClassesEnabled: true, };14 collapsed lines
const layer = new FeatureLayer({ // Fetch from a service containing primary road features. url: "https://services2.arcgis.com/FiaPA4ga0iQKduv3/ArcGIS/rest/services/Transportation_v1/FeatureServer/1", title: "US Road System", renderer, minScale: 0, maxScale: 0, });
viewElement.map.add(layer); // Add the layer to the map. </script> </body></html>Points of interest (3D)
This example demonstrates how to visualize points of interest (POI) in a 3D scene. This demo shows how to create POI symbols with a PictureMarkerSymbol. You can also use web styles to create the same visualization.
- Create a unique value renderer
A unique value renderer is a renderer that defines a distinct symbol for each unique data value returned from a field or expression in a layer. . - Reference the field name containing the location type (e.g.
museum,park, etc.). - Create unique value info objects and assign a symbol to each expected value.
89 collapsed lines
<!doctype html><html> <head> <meta charset="utf-8" /> <title>Points of interest</title>
<link rel="stylesheet" href="https://js.arcgis.com/5.1/esri/themes/light/main.css" /> <!-- Load the ArcGIS Maps SDK for JavaScript from CDN --> <script type="module" src="https://js.arcgis.com/5.1/"></script>
<style> html, body, #viewDiv { height: 100%; margin: 0; } </style>
<script type="module"> const [WebScene, FeatureLayer, SceneView, Legend, Expand] = await $arcgis.import([ "@arcgis/core/WebScene.js", "@arcgis/core/layers/FeatureLayer.js", "@arcgis/core/views/SceneView.js", "@arcgis/core/widgets/Legend.js", "@arcgis/core/widgets/Expand.js", ]);
// Load the webscene with buildings
const webscene = new WebScene({ portalItem: { // autocasts as new PortalItem() id: "711ddecedece4fd88b728bfe4322c22b", }, });
const view = new SceneView({ container: "viewDiv", map: webscene, environment: { lighting: { directShadowsEnabled: true, }, }, });
// verticalOffset shifts the symbol vertically const verticalOffset = { screenLength: 40, maxWorldLength: 200, minWorldLength: 35, };
// Function that automatically creates the symbol for the points of interest function getUniqueValueSymbol(name, color) { // The point symbol is visualized with an icon symbol. To clearly see the location of the point // we displace the icon vertically and add a callout line. The line connects the offset symbol with the location // of the point feature. return { type: "point-3d", symbolLayers: [ { type: "icon", resource: { href: name, }, size: 20, outline: { color: "white", size: 2, }, }, ],
verticalOffset: verticalOffset,
callout: { type: "line", color: "white", size: 2, border: { color: color, }, }, }; }
// Expand the code above to view how each marker // symbol is created in getUniqueValueSymbol() const pointsRenderer = { type: "unique-value", field: "Type", uniqueValueInfos: [ { value: "Museum", symbol: getUniqueValueSymbol( "https://developers.arcgis.com/javascript/latest/assets/sample-code/visualization-point-styles/Museum.avif", "#D13470", ), }, { value: "Restaurant", symbol: getUniqueValueSymbol( "https://developers.arcgis.com/javascript/latest/assets/sample-code/visualization-point-styles/Restaurant.avif", "#F97C5A", ), }, { value: "Church", symbol: getUniqueValueSymbol( "https://developers.arcgis.com/javascript/latest/assets/sample-code/visualization-point-styles/Church.avif", "#884614", ), }, { value: "Hotel", symbol: getUniqueValueSymbol( "https://developers.arcgis.com/javascript/latest/assets/sample-code/visualization-point-styles/Hotel.avif", "#56B2D6", ), }, { value: "Park", symbol: getUniqueValueSymbol( "https://developers.arcgis.com/javascript/latest/assets/sample-code/visualization-point-styles/Park.avif", "#40C2B4", ), }, ], };64 collapsed lines
// Create the layer with the points of interest // Initially points are aligned to the buildings with relative-to-scene, // feature reduction is set to "selection" to avoid overlapping icons. // A perspective view is enabled on the layers by default. const pointsLayer = new FeatureLayer({ url: "http://services.arcgis.com/V6ZHFr6zdgNZuVG0/arcgis/rest/services/LyonPointsOfInterest/FeatureServer", title: "Touristic attractions", elevationInfo: { // elevation mode that will place points on top of the buildings or other SceneLayer 3D objects mode: "relative-to-scene", }, renderer: pointsRenderer, outFields: ["*"], // feature reduction is set to selection because our scene contains too many points and they overlap featureReduction: { type: "selection", }, labelingInfo: [ { labelExpressionInfo: { value: "{Name}", }, symbol: { type: "label-3d", // autocasts as new LabelSymbol3D() symbolLayers: [ { type: "text", // autocasts as new TextSymbol3DLayer() material: { color: "white", }, // we set a halo on the font to make the labels more visible with any kind of background halo: { size: 1, color: [50, 50, 50], }, size: 10, }, ], }, }, ], });
webscene.add(pointsLayer);
const legend = new Legend({ view });
view.ui.add( new Expand({ view, content: legend, expanded: true, }), "top-right", ); </script> </head>
<body> <div id="viewDiv" class="esri-widget"></div> </body></html>Ordinal data
This example demonstrates how to create ordinal categories from a numeric field attribute using an Arcade expression. This app classifies highways by low, medium, or high truck traffic.
- Create a unique value renderer.
- Write an Arcade expression to classify the data into ordinal categories: low, medium, and high. Then reference it in the
valueExpressionproperty. See the snippet below. - Create unique value info objects and assign a symbol to each expected value.
- You can optionally add a default symbol to represent all features that don’t have a matching value.
var traffic = $feature.AADT; When( traffic > 80000, "High", traffic > 20000, "Medium", "Low" );32 collapsed lines
<!doctype html><html> <head> <meta charset="utf-8" /> <meta name="viewport" content="width=device-width, initial-scale=1, shrink-to-fit=no" /> <title>Esri Developer Guide: Arcade-Unique types</title>
<link rel="stylesheet" href="https://js.arcgis.com/5.1/esri/themes/light/main.css" /> <!-- Load the ArcGIS Maps SDK for JavaScript from CDN --> <script type="module" src="https://js.arcgis.com/5.1/"></script>
<script type="text/arcade" id="traffic-classification">
var traffic = $feature.AADT; When( traffic > 80000, "High", traffic > 20000, "Medium", "Low" );
</script>
<script type="module"> const [Map, MapView, FeatureLayer, Legend, Expand] = await $arcgis.import([ "@arcgis/core/Map.js", "@arcgis/core/views/MapView.js", "@arcgis/core/layers/FeatureLayer.js", "@arcgis/core/widgets/Legend.js", "@arcgis/core/widgets/Expand.js", ]);
const renderer = { type: "unique-value", valueExpression: ` var traffic = $feature.AADT; When( traffic > 80000, "High", traffic > 20000, "Medium", "Low" ); `, valueExpressionTitle: "Traffic volume", uniqueValueInfos: [ { value: "High", symbol: { type: "simple-line", color: "#810f7c", width: "6px", style: "solid", }, }, { value: "Medium", symbol: { type: "simple-line", color: "#8c96c6", width: "3px", style: "solid", }, }, { value: "Low", symbol: { type: "simple-line", color: "#9d978b", width: "1px", style: "solid", }, }, ], };55 collapsed lines
// Set the renderer on the layer const layer = new FeatureLayer({ url: "https://services.arcgis.com/V6ZHFr6zdgNZuVG0/arcgis/rest/services/Florida_Annual_Average_Daily_Traffic/FeatureServer/0", renderer: renderer, title: "Annual average daily traffic", minScale: 0, maxSclae: 0, });
// Add the layer to the map const map = new Map({ basemap: "gray-vector", layers: [layer], });
const view = new MapView({ container: "viewDiv", map: map, center: [-80.215, 25.856], rotation: 90, scale: 144447, constraints: { snapToZoom: false, }, });
view.ui.add( new Expand({ content: new Legend({ view: view, }), view: view, expanded: true, }), "top-right", ); </script>
<style> html, body, #viewDiv { background-color: rgba(15, 15, 15, 1); height: 100%; margin: 0; } </style> </head>
<body> <div id="viewDiv"></div> </body></html>Categorical data (3D)
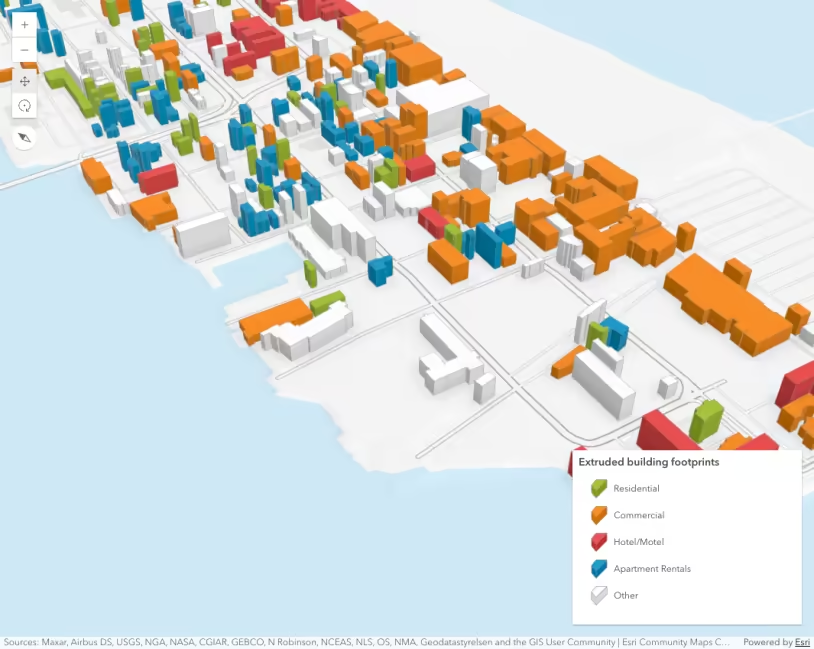
This example visualizes buildings based on building type: residential, commercial or mixed use. A unique value renderer assigns a color to each building based on the building’s usage attribute.
Steps
- Create different symbols for each building type.
- Assign the symbols to a unique value renderer.
- Assign the renderer to the scene layer.
29 collapsed lines
<!doctype html><html> <head> <meta charset="utf-8" /> <meta name="viewport" content="width=device-width, initial-scale=1, shrink-to-fit=no" /> <title>Esri Developer Guide: Visualize buildings by type</title>
<link rel="stylesheet" href="https://js.arcgis.com/5.1/esri/themes/light/main.css" /> <!-- Load the ArcGIS Maps SDK for JavaScript from CDN --> <script type="module" src="https://js.arcgis.com/5.1/"></script>
<style> html, body, #viewDiv { height: 100%; margin: 0; } </style>
<script type="module"> const [Map, SceneView, SceneLayer, Legend] = await $arcgis.import([ "@arcgis/core/Map.js", "@arcgis/core/views/SceneView.js", "@arcgis/core/layers/SceneLayer.js", "@arcgis/core/widgets/Legend.js", ]);
const typeRenderer = { type: "unique-value", legendOptions: { title: "Building Type", }, defaultSymbol: { type: "mesh-3d", symbolLayers: [ { type: "fill", material: { color: "#FFB55A", colorMixMode: "replace" }, }, ], }, defaultLabel: "Others", field: "landuse", uniqueValueInfos: [ { value: "MIPS", symbol: { type: "mesh-3d", symbolLayers: [ { type: "fill", material: { color: "#FD7F6F", colorMixMode: "replace" }, }, ], }, label: "Office", }, { value: "RESIDENT", symbol: { type: "mesh-3d", symbolLayers: [ { type: "fill", material: { color: "#7EB0D5", colorMixMode: "replace" }, }, ], }, label: "Residential", }, { value: "MIXRES", symbol: { type: "mesh-3d", symbolLayers: [ { type: "fill", material: { color: "#BD7EBE", colorMixMode: "replace" }, }, ], }, label: "Mixed use", }, { value: "MIXED", symbol: { type: "mesh-3d", symbolLayers: [ { type: "fill", material: { color: "#B2E061", colorMixMode: "replace" }, }, ], }, label: "Mixed use without residential", }, ], };38 collapsed lines
// Set the renderer on the layer const buildingLayer = new SceneLayer({ url: "https://services.arcgis.com/V6ZHFr6zdgNZuVG0/arcgis/rest/services/SF_BLDG_WSL1/SceneServer/0", renderer: typeRenderer, title: "San Francisco Buildings", });
// Add the layer to the map const map = new Map({ basemap: "gray-vector", layers: [buildingLayer], });
const view = new SceneView({ container: "viewDiv", map, camera: { position: [-122.3966368, 37.77924265, 1294.5539], heading: 346.67, tilt: 46.8, }, });
view.ui.add( new Legend({ view, }), "top-right", ); </script> </head>
<body> <div id="viewDiv"></div> </body></html>Related samples and resources
Visualize features by type
Generate data-driven visualization of unique values
Coloring options for textured buildings
Extrude building footprints based on real world heights
Create a custom visualization using Arcade
API support
| 2D | 3D | Arcade | Points | Lines | Polygons | Mesh | |
|---|---|---|---|---|---|---|---|
| | | | | | | | |
| | | | | | | | |
| | | | | | | ||
| | | | | | | | |
| | | | | | | | |
| | | | | | | | |
| | | | | | | | |
| | | | | | | | |
| | | | | | | | |
| | | |
- Color only
- Size variable creators only supported for points
- Size variable creators not supported in 3D