Weather stations styled with a simple renderer and visual variables to display wind speed, direction, and air temperature
What is multivariate data visualization?
Multivariate data visualization involves visualizing more than one data value in a single renderer. This is done for many reasons, including to:
- View the relationship between two or more variables
- Compare or contrast the difference between two variables
- View spatial patterns that may not be related among several variables at one time.
How multivariate data visualizations work
Multivariate visualizations can be done by adding more than one visual variable to a simple renderer. Common combinations include the following:
- Color and size
- Size and rotation
- Size, rotation, and color
You can create multivariate visualizations using many other combinations of visual variables as well, including opacity.
Examples
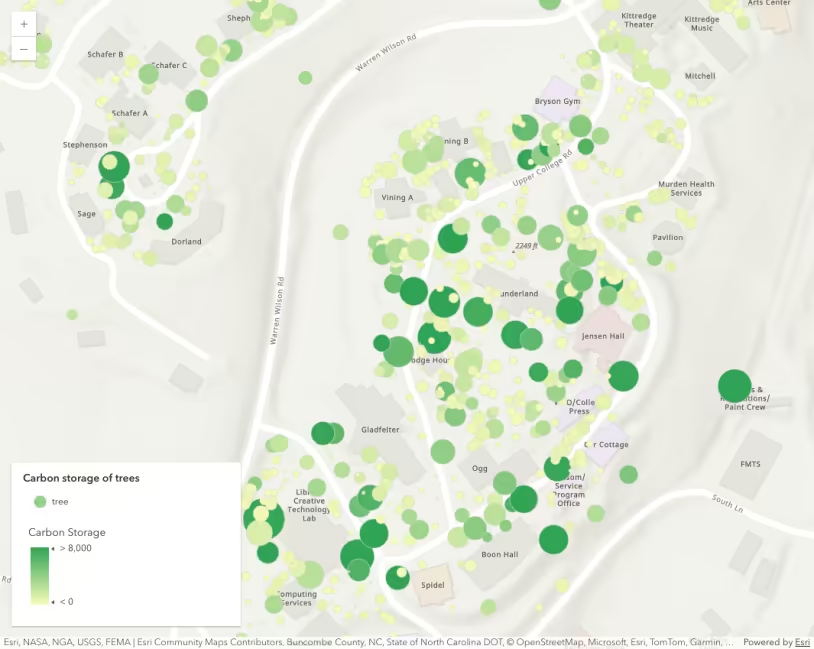
Color and size
Color and size are typically used to show the relationship between two variables or to show a rate with a color variable, and the magnitude of a variable using a size variable.
The following example visualizes how humidity influences the heat index, or the “feels like” temperature using color and size.
- color is used to visualize relative humidity
- size is used to visualize the difference between the heat index (feels like temperature) and the measured air temperature at a weather station.
42 collapsed lines
<!doctype html><html> <head> <meta charset="utf-8" /> <meta name="viewport" content="width=device-width, initial-scale=1, shrink-to-fit=no" /> <title>Esri Developer Guide: Visual variables (size and color)</title> <style> html, body, #viewDiv { height: 100%; margin: 0; } </style>
<link rel="stylesheet" href="https://js.arcgis.com/5.1/esri/themes/light/main.css" /> <!-- Load the ArcGIS Maps SDK for JavaScript from CDN --> <script type="module" src="https://js.arcgis.com/5.1/"></script>
<script type="module"> const [Map, MapView, FeatureLayer, Legend, Expand] = await $arcgis.import([ "@arcgis/core/Map.js", "@arcgis/core/views/MapView.js", "@arcgis/core/layers/FeatureLayer.js", "@arcgis/core/widgets/Legend.js", "@arcgis/core/widgets/Expand.js", ]);
const renderer = { type: "simple", symbol: { type: "simple-marker", style: "circle", color: [50, 50, 50], outline: { color: [255, 255, 255, 0.5], width: 0.5, }, size: "8px", },
visualVariables: [ { type: "size", valueExpression: "$feature.HEAT_INDEX - $feature.TEMP", valueExpressionTitle: "Difference in 'feels like' temperature from air temperature", minDataValue: 0, maxDataValue: 30, minSize: 4, maxSize: 24, }, { type: "color", field: "R_HUMIDITY", stops: [ { value: 20, color: "#ffefdc" }, { value: 35, color: "#edac90" }, { value: 50, color: "#da6843" }, { value: 65, color: "#a03523" }, { value: 80, color: "#660202" }, ], }, ],48 collapsed lines
};
// Set the renderer on the feature layer const layer = new FeatureLayer({ portalItem: { id: "cb1886ff0a9d4156ba4d2fadd7e8a139", }, title: "Current weather conditions", renderer: renderer, });
const map = new Map({ basemap: { portalItem: { id: "ba223f982a3c4a0ea8c9953346e2a201", }, }, layers: [layer], });
const view = new MapView({ container: "viewDiv", map: map, scale: 36978595, center: [-80.48, 28.3], constraints: { snapToZoom: false, }, });
view.ui.add( new Expand({ content: new Legend({ view: view, }), view: view, expanded: false, }), "top-right", ); </script> </head> <body> <div id="viewDiv"></div> </body></html>Size and rotation
Size variables are good for visualization total counts or magnitudes. Rotation and size are commonly paired together to map weather data, such as wind. Rotation indicates the direction of flow, while size indicates the wind speed.
46 collapsed lines
<!doctype html><html> <head> <meta charset="utf-8" /> <meta name="viewport" content="width=device-width, initial-scale=1, shrink-to-fit=no" /> <title>Esri Developer Guide: Visual variables (size and rotation)</title> <style> html, body, #viewDiv { height: 100%; margin: 0; } </style>
<link rel="stylesheet" href="https://js.arcgis.com/5.1/esri/themes/light/main.css" /> <!-- Load the ArcGIS Maps SDK for JavaScript from CDN --> <script type="module" src="https://js.arcgis.com/5.1/"></script>
<script type="module"> const [Map, MapView, FeatureLayer, Legend, Expand] = await $arcgis.import([ "@arcgis/core/Map.js", "@arcgis/core/views/MapView.js", "@arcgis/core/layers/FeatureLayer.js", "@arcgis/core/widgets/Legend.js", "@arcgis/core/widgets/Expand.js", ]);
const referenceScale = 9244650 * 2;
const renderer = { type: "simple", symbol: { type: "simple-marker", // Arrow marker defined as SVG path path: "M14.5,29 23.5,0 14.5,9 5.5,0z", color: [50, 50, 50], outline: { color: [255, 255, 255, 0.5], width: 0.5, }, angle: 180, size: "20px", },
visualVariables: [ { type: "size", field: "WIND_SPEED", minDataValue: 5, maxDataValue: 60, minSize: 4, maxSize: 24, }, { type: "rotation", field: "WIND_DIRECT", rotationType: "geographic", }, ],48 collapsed lines
};
// Set the renderer on the feature layer const layer = new FeatureLayer({ portalItem: { id: "cb1886ff0a9d4156ba4d2fadd7e8a139", }, title: "Current weather conditions", renderer: renderer, });
const map = new Map({ basemap: { portalItem: { id: "ba223f982a3c4a0ea8c9953346e2a201", }, }, layers: [layer], });
const view = new MapView({ container: "viewDiv", map: map, scale: referenceScale, center: [-95, 38.5], constraints: { snapToZoom: false, }, });
view.ui.add( new Expand({ content: new Legend({ view: view, }), view: view, expanded: false, }), "top-right", ); </script> </head> <body> <div id="viewDiv"></div> </body></html>Size, rotation, and color
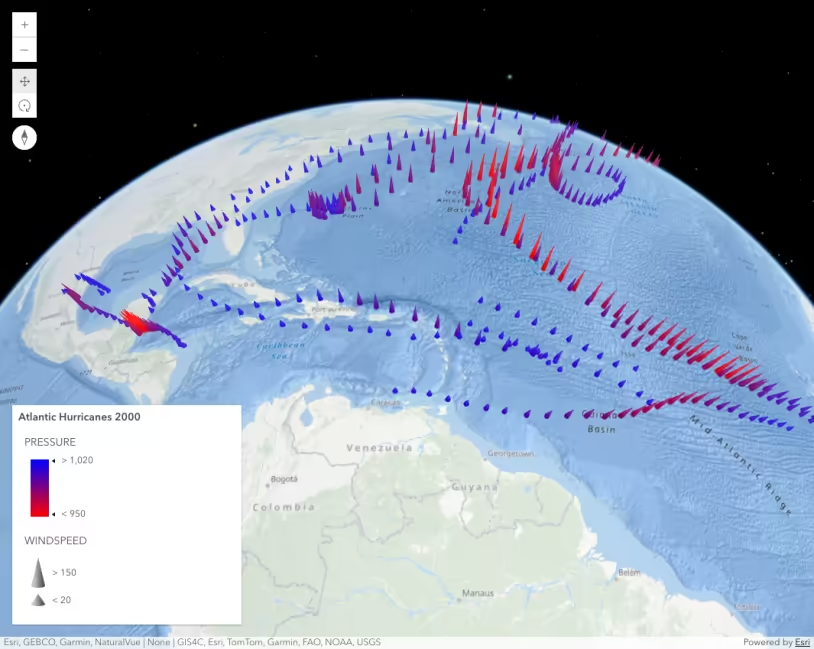
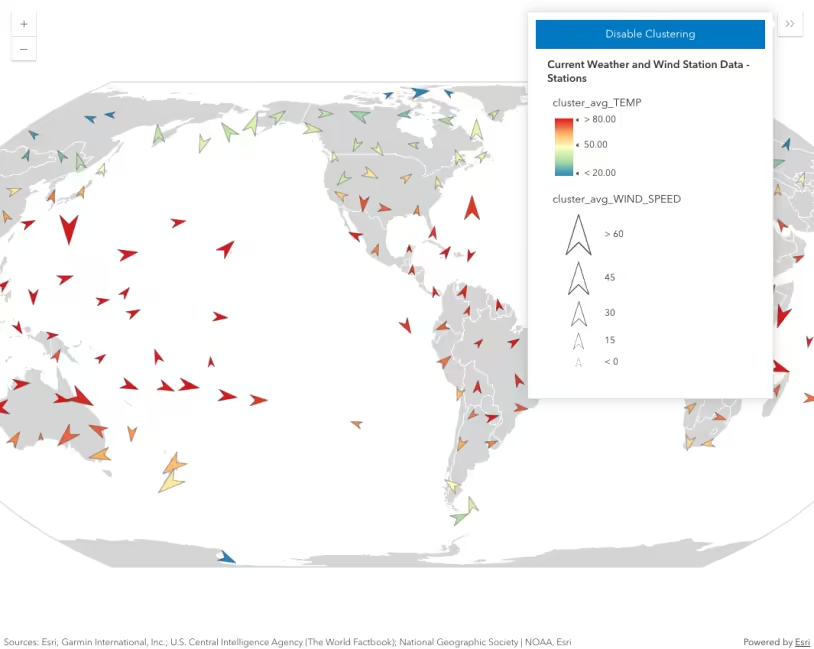
In rare cases, you can effectively use three visual variables together. In the example below, we add a color variable to the wind visualization to represent air temperature. This visualization allows the end user to view patterns of wind and temperature together in one visual.
- Size - wind speed
- Rotation - wind direction
- Color - air temperature
Pan and zoom the map to explore wind speed, direction, and air temperature.
46 collapsed lines
<!doctype html><html> <head> <meta charset="utf-8" /> <meta name="viewport" content="width=device-width, initial-scale=1, shrink-to-fit=no" /> <title>Esri Developer Guide: Multiple visual variables</title> <style> html, body, #viewDiv { height: 100%; margin: 0; } </style>
<link rel="stylesheet" href="https://js.arcgis.com/5.1/esri/themes/light/main.css" /> <!-- Load the ArcGIS Maps SDK for JavaScript from CDN --> <script type="module" src="https://js.arcgis.com/5.1/"></script>
<script type="module"> const [Map, MapView, FeatureLayer, Legend, Expand] = await $arcgis.import([ "@arcgis/core/Map.js", "@arcgis/core/views/MapView.js", "@arcgis/core/layers/FeatureLayer.js", "@arcgis/core/widgets/Legend.js", "@arcgis/core/widgets/Expand.js", ]);
const referenceScale = 9244650 * 2;
const renderer = { type: "simple", symbol: { type: "simple-marker", // Arrow marker defined as SVG path path: "M14.5,29 23.5,0 14.5,9 5.5,0z", color: [250, 250, 250], outline: { color: [255, 255, 255, 0.5], width: 0.5, }, angle: 180, size: 15, },
visualVariables: [ { type: "rotation", field: "WIND_DIRECT", rotationType: "geographic", }, { type: "size", field: "WIND_SPEED", minDataValue: 5, maxDataValue: 60, minSize: { type: "size", valueExpression: "$view.scale", // adjust the min size by scale stops: [ { value: referenceScale, size: 8 }, { value: referenceScale * 2, size: 6 }, { value: referenceScale * 4, size: 4 }, { value: referenceScale * 8, size: 2 }, ], }, maxSize: { type: "size", valueExpression: "$view.scale", // adjust the max size by scale stops: [ { value: referenceScale, size: 40 }, { value: referenceScale * 2, size: 30 }, { value: referenceScale * 4, size: 20 }, { value: referenceScale * 8, size: 10 }, ], }, }, { type: "color", field: "TEMP", stops: [ { value: 20, color: "#2b83ba" }, { value: 35, color: "#abdda4" }, { value: 50, color: "#ffffbf" }, { value: 65, color: "#fdae61" }, { value: 80, color: "#d7191c" }, ], }, ],48 collapsed lines
};
// Set the renderer on the feature layer const layer = new FeatureLayer({ portalItem: { id: "cb1886ff0a9d4156ba4d2fadd7e8a139", }, title: "Current weather conditions", renderer: renderer, });
const map = new Map({ basemap: { portalItem: { id: "ba223f982a3c4a0ea8c9953346e2a201", }, }, layers: [layer], });
const view = new MapView({ container: "viewDiv", map: map, scale: referenceScale, center: [-95, 38.5], constraints: { snapToZoom: false, }, });
view.ui.add( new Expand({ content: new Legend({ view: view, }), view: view, expanded: false, }), "top-right", ); </script> </head> <body> <div id="viewDiv"></div> </body></html>Best practices
Using more than one visual variable adds complexity to the visualization. This makes it more difficult for the end user to understand the message. You should always carefully consider whether using multiple variables in one view is preferable to displaying separate views of the data.
Other multivariate styles
You don’t need visual variables to create multivariate visualizations. The following guide pages demonstrate how to create multivariate visualizations with other renderer types.
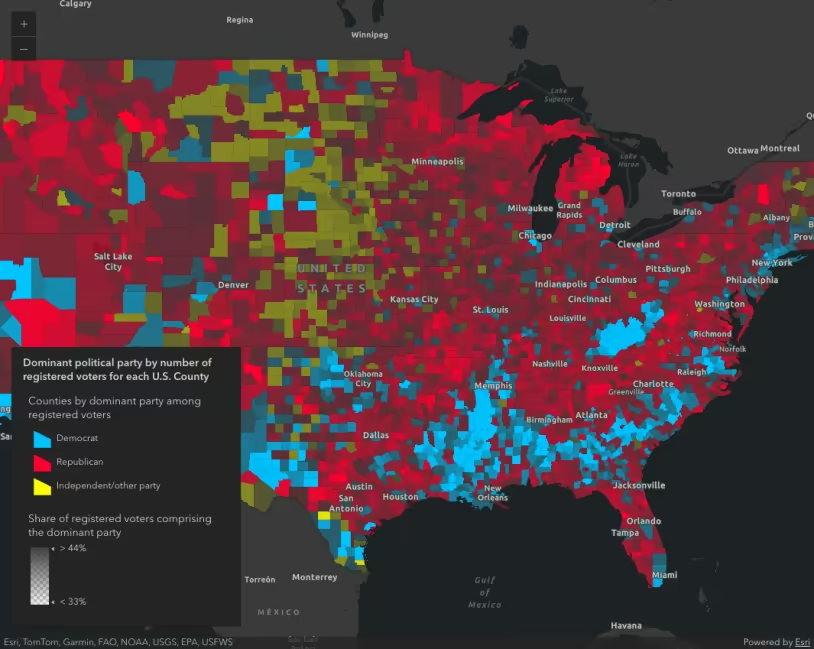
Predominance
A predominance visualization colors features based on the predominant value among a set of competing or similar numeric attributes.
Dot density
Learn how to use dot density to measure the density of a numeric attribute or set of comparable variables.
Charts
Learn how to use charts to visualize the distribution of multiple numeric variables in a layer.
Relationship
Learn how to use a relationship renderer to explore the relationship between two numeric data attributes.
Related samples and resources
Create a custom visualization using Arcade
Thematic multivariate visualization (3D)
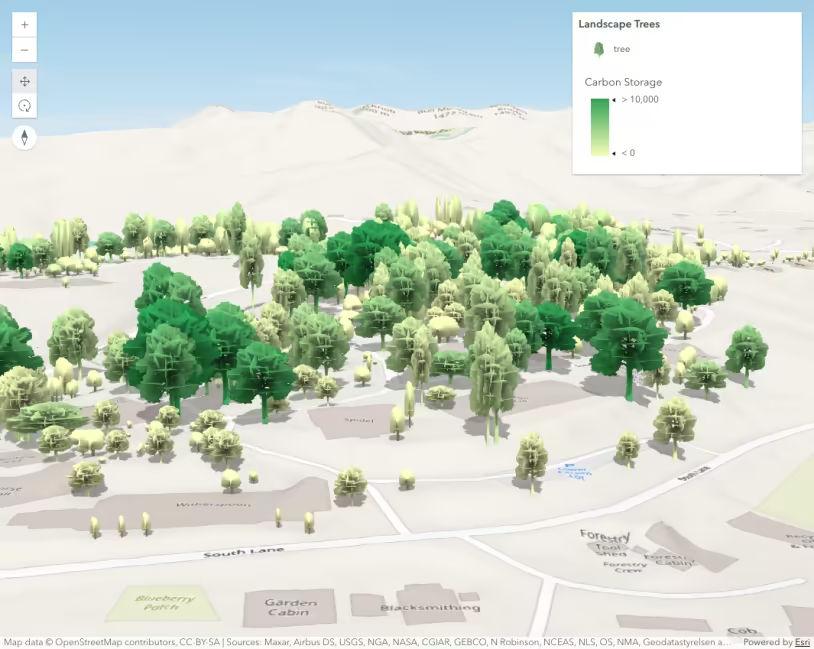
Thematic visualization with realistic 3D symbols
Scale feature sizes based on real world sizes (2D)
Clustering with visual variables
API support
| 2D | 3D | Arcade | Points | Lines | Polygons | Mesh | |
|---|---|---|---|---|---|---|---|
| | | | | | | | |
| | | | | | | | |
| | | | | | | ||
| | | | | | | | |
| | | | | | | | |
| | | | | | | | |
| | | | | | | | |
| | | | | | | | |
| | | | | | | | |
| | | |
- Color only
- Size variable creators only supported for points
- Size variable creators not supported in 3D