Data visualization has a paradox: to properly visualize a dataset, you first need to be familiar with it; but to understand the data, you usually first have to visualize it.
Understanding the data involves knowing summary statistics, such as the maximum and minimum values, the mean, standard deviation, and the overall distribution. Without that understanding, you can easily create misleading visualizations and spend a lot of time on trial and error before getting a visualization right.
In addition to understanding the data, you should also be familiar with basic principles of cartography and color theory when creating a spatial data visualization. Not everyone has an eye for design and understands problems associated with visualizing numeric and categorical data with color.
In short, data visualization is hard and requires a lot of patience.
What is Smart Mapping?
Smart Mapping is designed to help developers get started with data visualization. It consists of more than a dozen APIs that generate renderers specific to an input dataset. These APIs are designed to help users and developers understand their data so they can make informed decisions best suited for visualizing it.
Smart mapping will help you understand the nature of the data (the statistics and spread), and suggest a set of color ramps designed by seasoned cartographers specifically for the desired style.
Developers can use the Smart Mapping APIs to:
- Familiarize themselves with an unknown or unfamiliar dataset.
- Select colorblind-friendly color ramps and schemes best suited for a layer given its background.
- Build apps that allow users to explore unfamiliar datasets using a variety of styles and widgets.
- Build apps that allow users to style layers and save them to webmaps.
How Smart Mapping works
Smart mapping consists of the following modules, organized by style:
- colorRendererCreator
- dotDensityRendererCreator
- heatmapRendererCreator
- locationRendererCreator
- opacityVariableCreator
- predominanceRendererCreator
- relationshipRendererCreator
- sizeRendererCreator
- typeRendererCreator
- univariateColorSizeRendererCreator
The createRenderer method in each of these modules queries the summary statistics of the data, and selects a color scheme best suited for the given basemap or background color of the view.
Each smart mapping method typically requires the following:
- The layer to which the output renderer will be applied
- The view where the layer is rendered
- The field or Arcade expression containing the data for the visualization
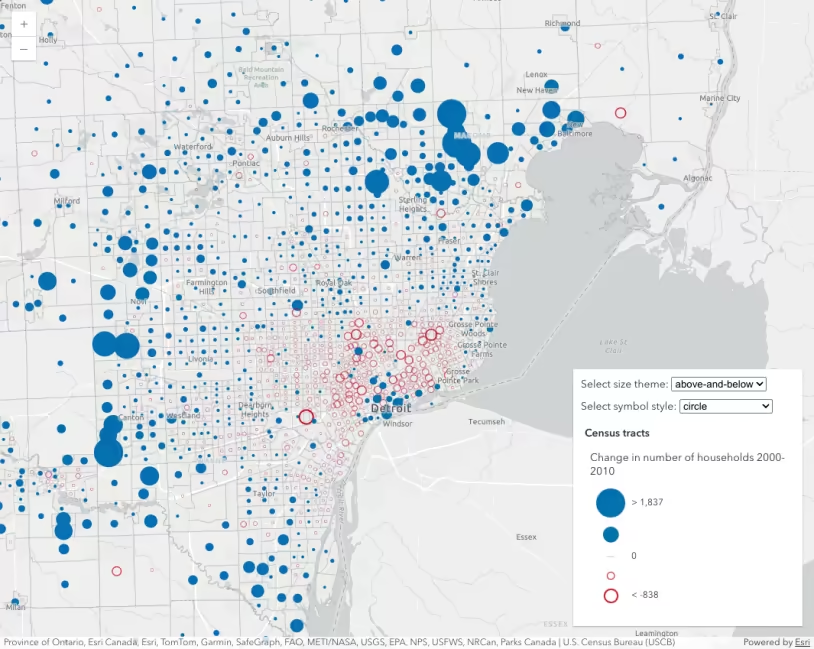
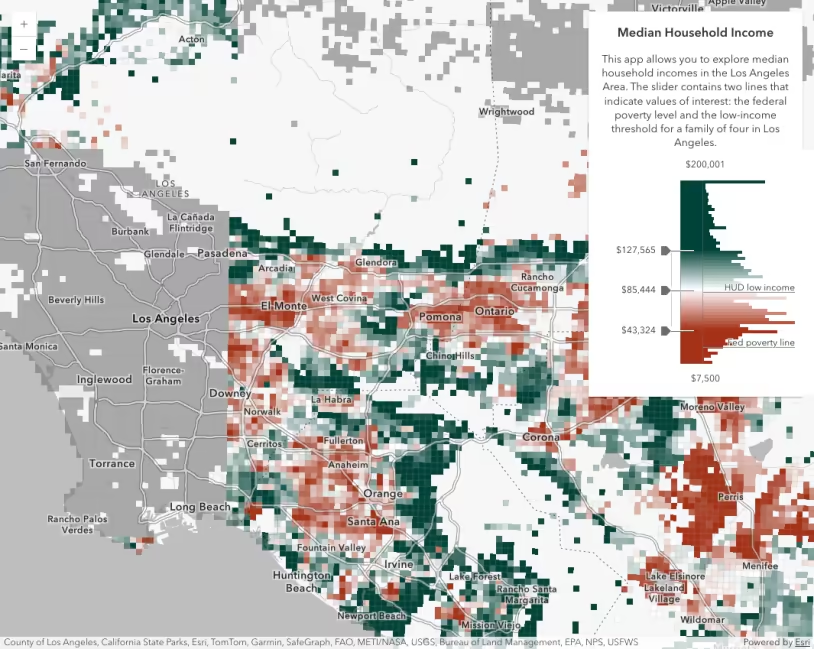
The following example generates a continuous color renderer along a diverging (i.e. above-and-below) color ramp.
const { renderer } = await colorRendererCreator.createContinuousRenderer({  layer: featureLayer,  view: mapView,  field: "Median_HH_Income",  theme: "above-and-below",});
featureLayer.renderer = renderer;The methods exposed by these modules may be used in conjunction with the following slider components:
- Classed Color Slider
- Classed Size Slider
- Color Size Slider
- Color Slider
- Heatmap Slider
- Opacity Slider
- Size Slider
Related samples and resources
Size visual variable themes
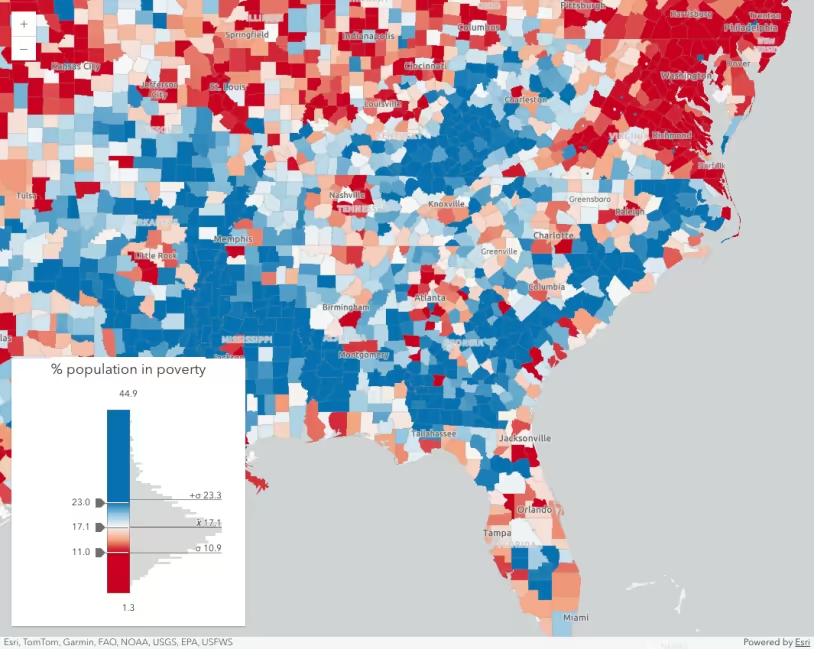
Generate continuous color visualization
Generate data-driven visualization of unique values
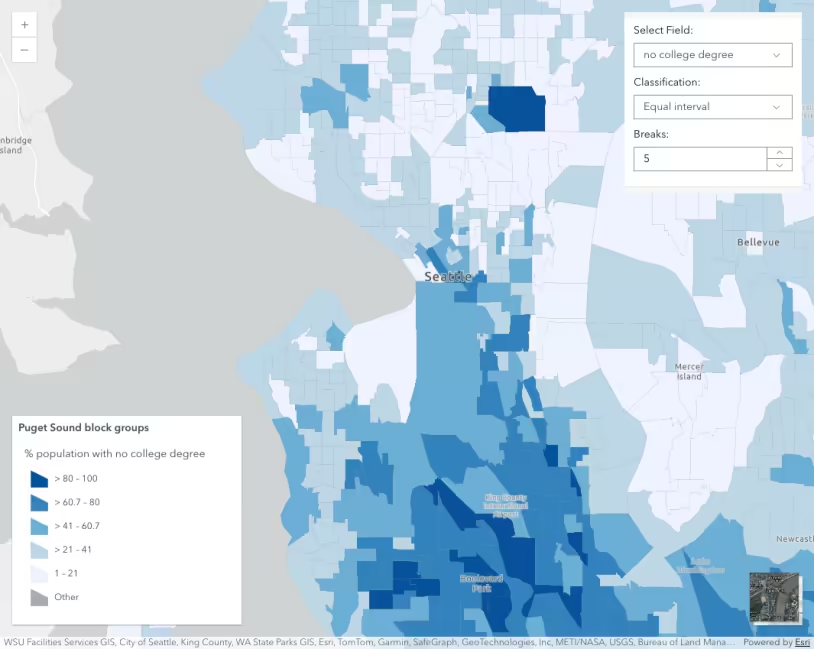
Generate a class breaks visualization
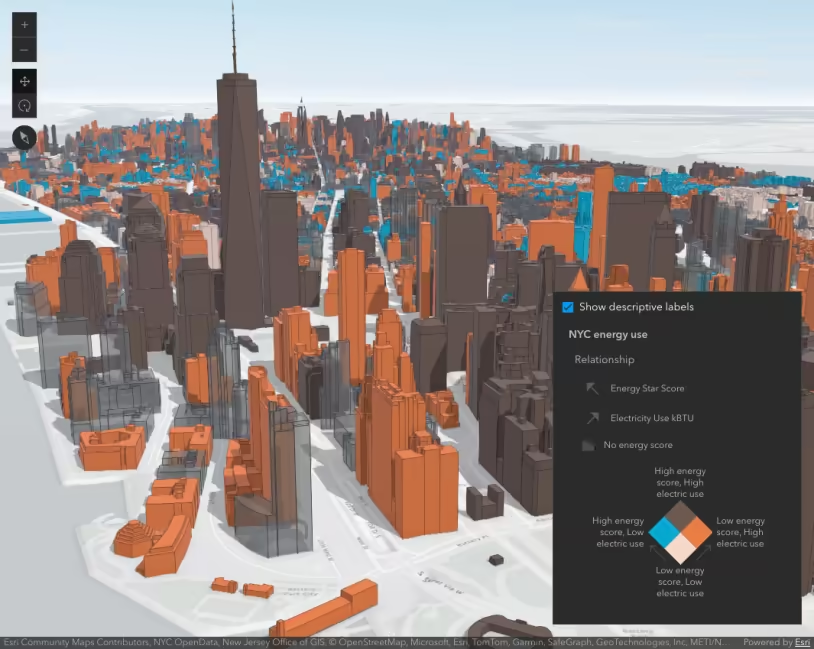
Generate a relationship visualization
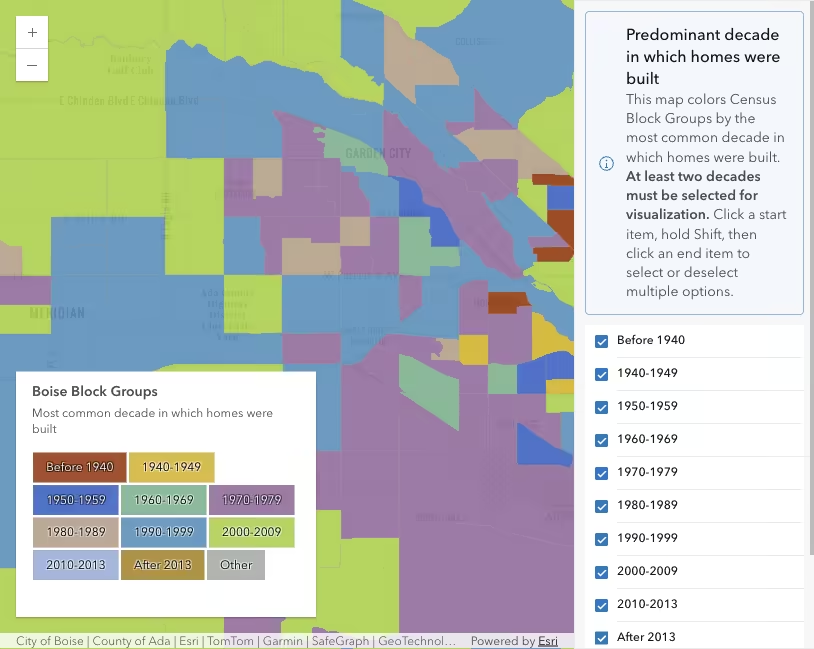
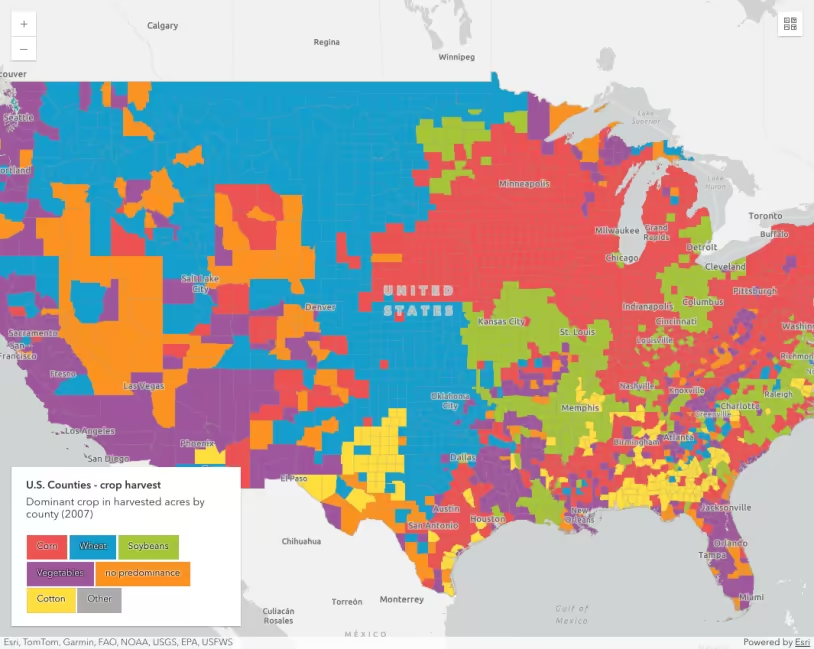
Generate a predominance visualization
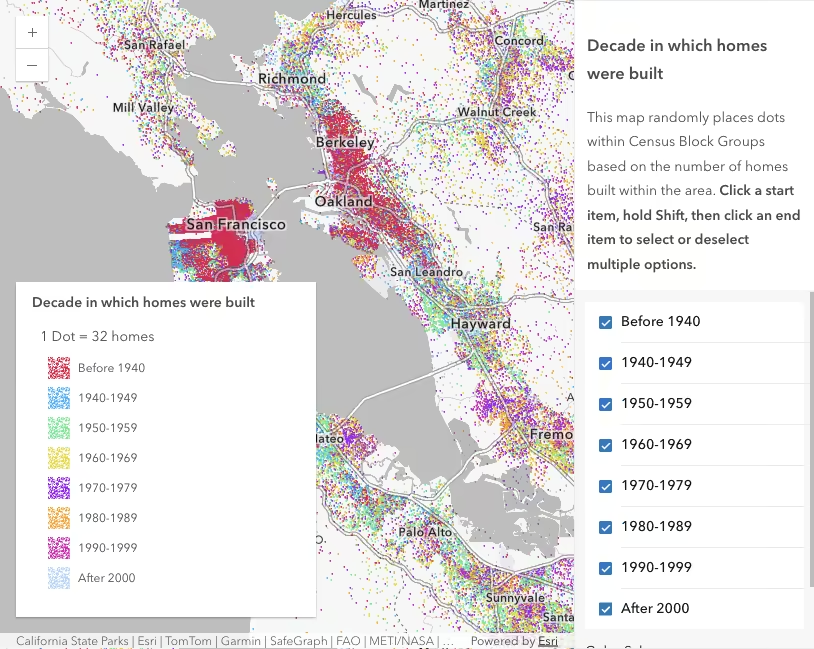
Generate a dot density visualization
Customize ColorSlider Histogram
API support
| 2D | 3D | Arcade | Points | Lines | Polygons | Mesh | |
|---|---|---|---|---|---|---|---|
| | | | | | | | |
| | | | | | | | |
| | | | | | | ||
| | | | | | | | |
| | | | | | | | |
| | | | | | | | |
| | | | | | | | |
| | | | | | | | |
| | | | | | | | |
| | | |
- Color only
- Size variable creators only supported for points
- Size variable creators not supported in 3D