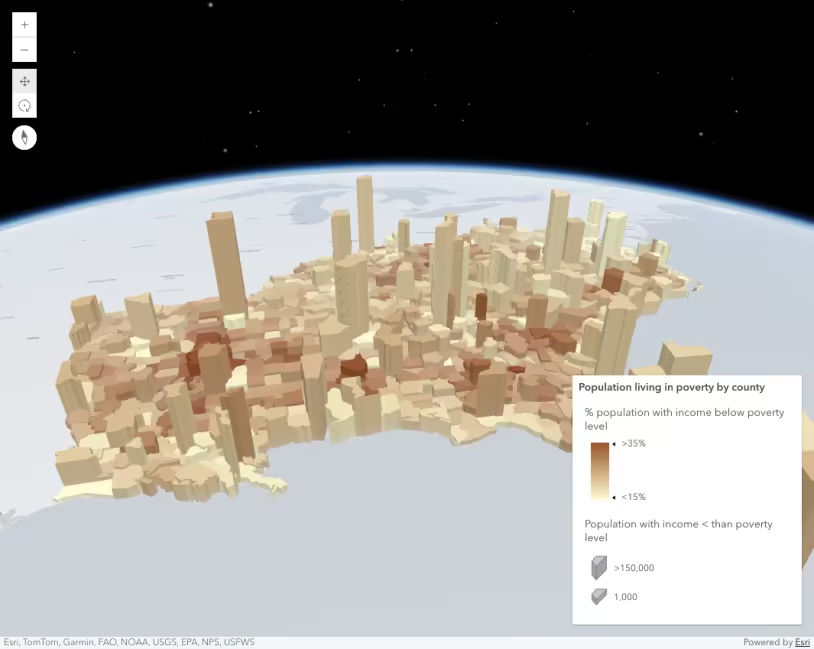
This sample demonstrates how to generate a data-driven continuous size visualization with different themes: above, below, and above-and-below. This is accomplished with the createContinuousRenderer() method in the univariateColorSize or size renderer creator objects.
These themes are well suited for some data variables, such as change in population between two years. The layer in this sample uses an Arcade expression to calculate the change in population from 2000 to 2010.
// TOTHU10 = Total population in 2010// TOTHU00 = Total population in 2000$feature.TOTHU10 - $feature.TOTHU00You can create several good visualizations with just that variable. The themes mentioned above help the user answer the following questions.
Where did the number of households increase from 2000-2010?
Theme: above
const params = {  layer,  view: viewElement.view,  theme: `above`,  valueExpression: `$feature.TOTHU10 - $feature.TOTHU00`,  valueExpressionTitle: `Increase in number of households 2000-2010`,  minValue: -1000,  maxValue: 2000,};
const { renderer } = await sizeRendererCreator.createContinuousRenderer(params);layer.renderer = renderer;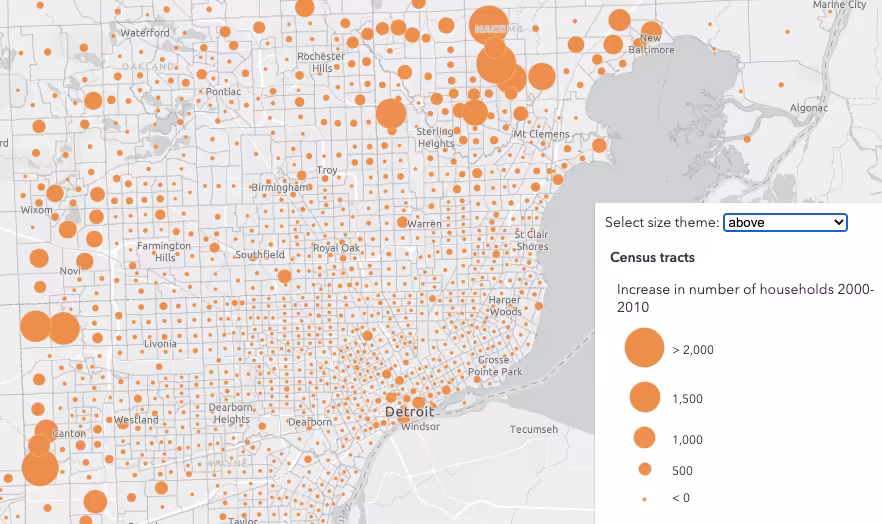
Where did the number of households decrease from 2000-2010?
Theme: below
const params = {  layer,  view: viewElement.view,  theme: `below`,  valueExpression: `$feature.TOTHU10 - $feature.TOTHU00`,  valueExpressionTitle: `Decrease in number of households 2000-2010`,  minValue: -1000,  maxValue: 2000,};
const { renderer } = await sizeRendererCreator.createContinuousRenderer(params);layer.renderer = renderer;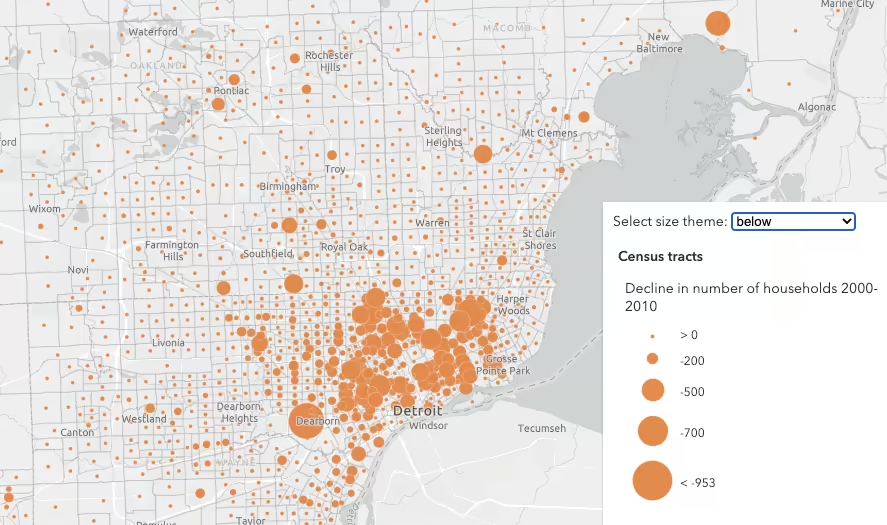
Where did the number of households increase or decrease from 2000-2010?
Theme: above-and-below
const params = {  layer,  view: viewElement.view,  theme: `above-and-below`,  valueExpression: `$feature.TOTHU10 - $feature.TOTHU00`,  valueExpressionTitle: `Change in number of households 2000-2010`,  symbolOptions: {    // Other symbol styles include the following:    //    // "caret" | "circle-caret" | "arrow" | "circle-arrow" |    // "plus-minus" | "circle-plus-minus" | "square" | "circle" |    // "triangle" | "happy-sad" | "thumb"    symbolStyle: "arrow"  }  minValue: -1000,  maxValue: 2000};
const { renderer } = await univariateColorSizeRendererCreator.createContinuousRenderer(params);layer.renderer = renderer;
A word of caution
Keep in mind that generating renderers should be avoided in most applications because of the performance cost affecting the end user. As stated in the Smart Mapping guide topic, the Smart Mapping APIs were designed for two types of applications: data exploration apps and visualization authoring apps similar to ArcGIS Online. In all other cases, renderers should be saved to the layer or manually created using any of the renderer classes.
Additional visualization samples and resources
Generate data-driven continuous size visualization
Data-driven continuous size