This sample demonstrates how to generate a data-driven visualization with unique values based on an attribute field containing categorical (or nominal) data.
This is accomplished with the createRenderer() in the type renderer creator helper object. All that is required for generating a renderer is a Feature Layer and a field name.
The createRenderer() method returns a set of symbols best suited to the given basemap. Notice that as you change the basemap using the BasemapGallery widget, the fill and outline of the symbols slightly change to a lighter or darker theme to be more visually appealing when contrasted with the basemap color.
const layer = new FeatureLayer({  url: "https://services.arcgis.com/V6ZHFr6zdgNZuVG0/arcgis/rest/services/US_county_crops_2007_clean/FeatureServer/0",});
const typeParams = {  layer: layer,  view: viewElement.view,  field: "DOM_CROP_ACRES",  legendOptions: {    title: "Dominant crop in harvested acres by county (2007)",  },};
typeRendererCreator  .createRenderer(typeParams)  .then((response) => {    // set the renderer to the layer and add it to the map    layer.renderer = response.renderer;    viewElement.map.add(layer);  })  .catch((error) => {    console.error("there was an error: ", error);  });
A word of caution
Keep in mind that generating renderers should be avoided in most applications because of the performance cost affecting the end user. As stated in the Smart Mapping guide topic, the Smart Mapping APIs were designed for two types of applications: data exploration apps and visualization authoring apps similar to ArcGIS Online. In all other cases, renderers should be saved to the layer or manually created using any of the renderer classes.
Related samples and resources
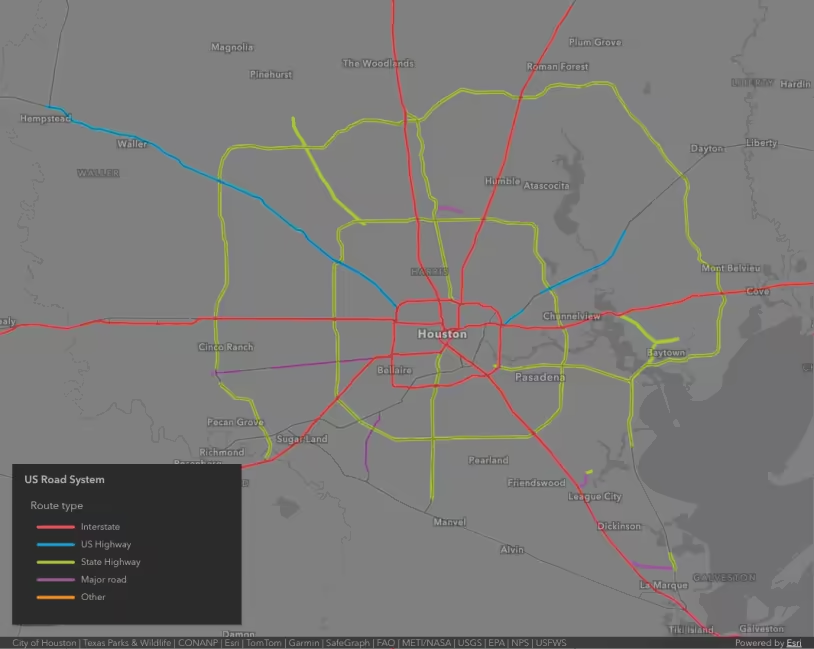
Visualize features by type
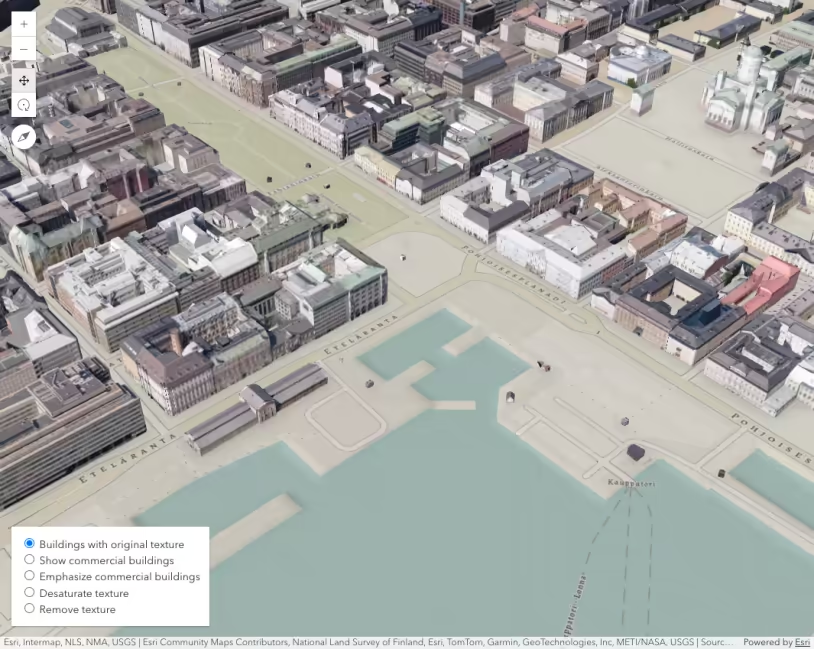
Coloring options for textured buildings
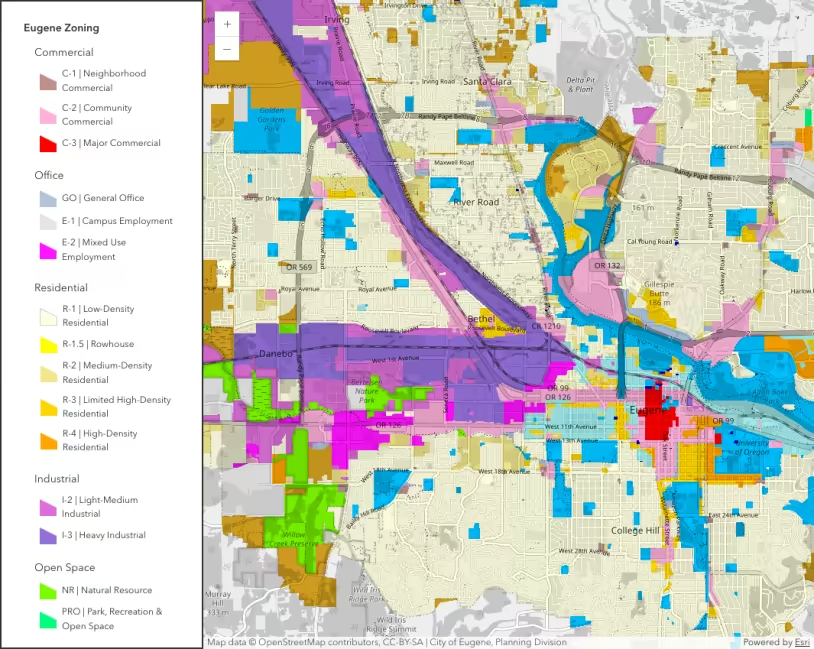
Unique value groups with headings
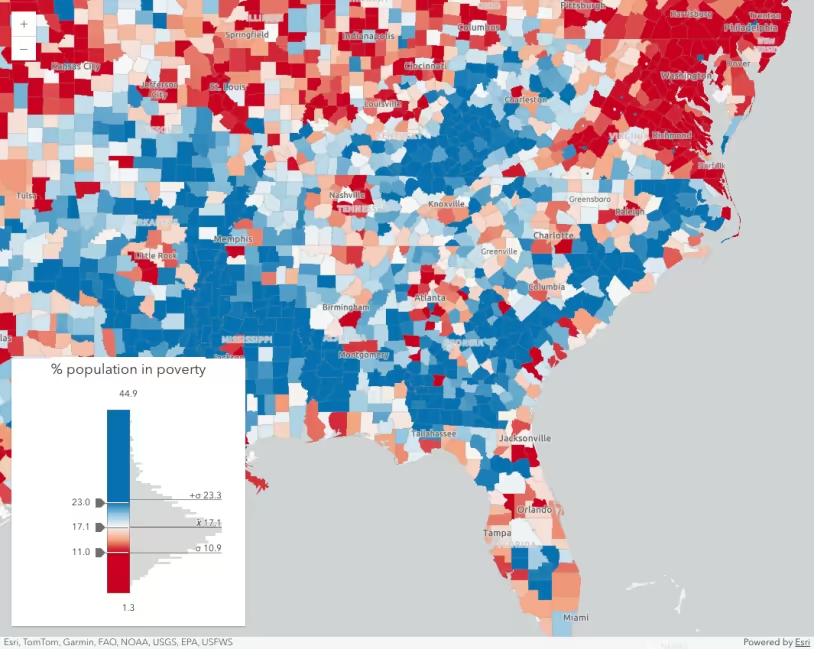
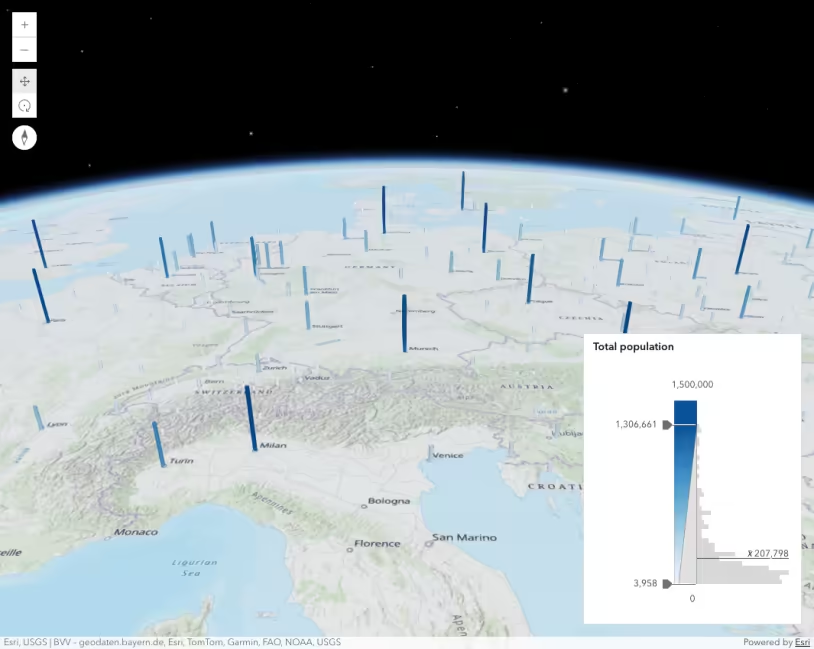
Generate continuous color visualization
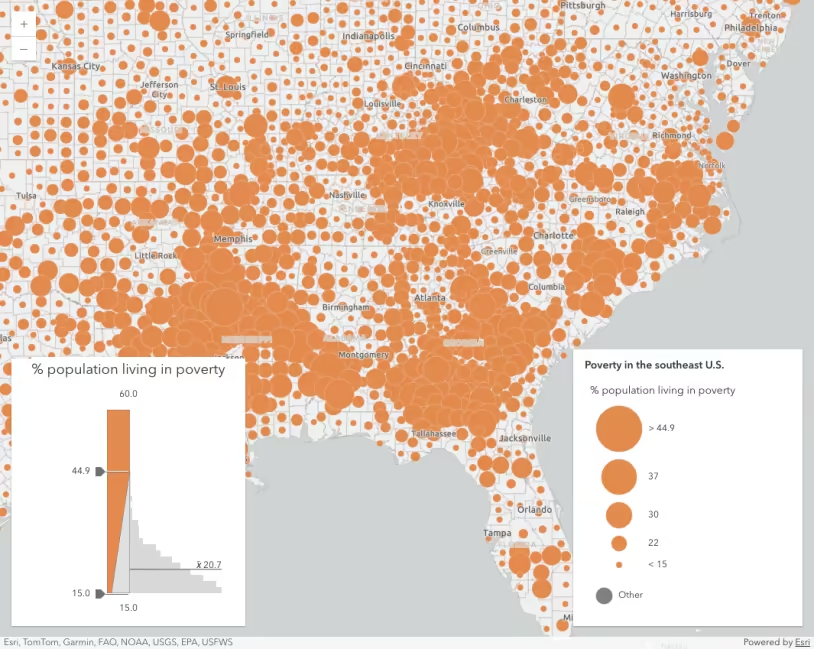
Generate data-driven continuous size visualization