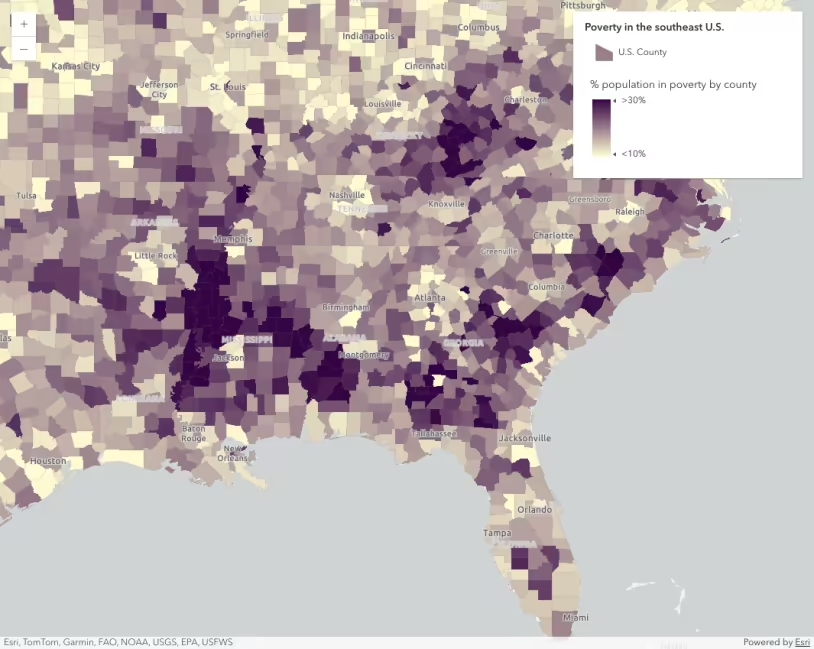
This sample demonstrates how to generate a data-driven continuous color visualization based on statistics returned from a numeric field or expression in a FeatureLayer.
This is accomplished with the createContinuousRenderer() in the color renderer creator helper object. All that is required for generating a renderer is a Feature Layer and a field name or expression.
// Configure parameters for the color renderer generator // the layer must be specified along with a field name // or an arcade expression. The view and other properties // determine the appropriate default color scheme. const colorParams = { layer: layer, valueExpression: "( $feature.POP_POVERTY / $feature.TOTPOP_CY ) * 100", view: viewElement.view, theme: "above-and-below", outlineOptimizationEnabled: true, };90 collapsed lines
<!doctype html><html lang="en"> <head> <meta charset="utf-8" /> <meta name="viewport" content="width=device-width, initial-scale=1, shrink-to-fit=no" /> <title>Generate continuous color visualization | Sample | ArcGIS Maps SDK for JavaScript</title>
<!-- Load the ArcGIS Maps SDK for JavaScript from CDN --> <script type="module" src="https://js.arcgis.com/5.1/"></script>
<style> html, body { height: 100%; margin: 0; }
calcite-card { padding: 6px; text-align: center; } </style> </head>
<body> <arcgis-map basemap="gray-vector" center="-85.0502, 33.125524" zoom="5"> <arcgis-popup slot="popup" dock-enabled></arcgis-popup> <arcgis-zoom slot="top-left"></arcgis-zoom> <calcite-card slot="bottom-left"> <h2>% population in poverty</h2> <arcgis-slider-color-legacy precision="1"></arcgis-slider-color-legacy> </calcite-card> </arcgis-map>
<script type="module"> const [FeatureLayer, colorRendererCreator, histogram] = await $arcgis.import([ "@arcgis/core/layers/FeatureLayer.js", "@arcgis/core/smartMapping/renderers/color.js", "@arcgis/core/smartMapping/statistics/histogram.js", ]);
const colorSlider = document.querySelector("arcgis-slider-color-legacy"); await colorSlider.componentOnReady();
// Create FeatureLayer instance with popupTemplate const layer = new FeatureLayer({ url: "https://services.arcgis.com/V6ZHFr6zdgNZuVG0/arcgis/rest/services/counties_politics_poverty/FeatureServer/0", popupTemplate: { // Autocasts as new PopupTemplate() title: "{COUNTY}, {STATE}", content: "{POP_POVERTY} of {TOTPOP_CY} people live below the poverty line.", fieldInfos: [ { fieldName: "POP_POVERTY", format: { digitSeparator: true, places: 0, }, }, { fieldName: "TOTPOP_CY", format: { digitSeparator: true, places: 0, }, }, ], }, });
// Add layer to map const viewElement = document.querySelector("arcgis-map"); document.querySelector("arcgis-popup").dockOptions = { breakpoint: false, }; await viewElement.viewOnReady(); viewElement.map.add(layer);
// Configure parameters for the color renderer generator // the layer must be specified along with a field name // or an arcade expression. The view and other properties // determine the appropriate default color scheme. const colorParams = { layer: layer, valueExpression: "( $feature.POP_POVERTY / $feature.TOTPOP_CY ) * 100", view: viewElement.view, theme: "above-and-below", outlineOptimizationEnabled: true, };
// Generate a continuous color renderer based on the // statistics of the data in the provided layer // and field normalized by the normalizationField. // // This resolves to an object containing several helpful // properties, including color scheme, statistics, // the renderer and visual variable const rendererResult = await colorRendererCreator.createContinuousRenderer(colorParams);
// Set the renderer to the layer and add it to the map layer.renderer = rendererResult.renderer;35 collapsed lines
// Generate a histogram for use in the slider. Input the layer // and field or arcade expression to generate it. const histogramResult = await histogram({ layer: layer, valueExpression: colorParams.valueExpression, view: viewElement.view, numBins: 70, });
// Construct a color slider from the result of both // smart mapping renderer and histogram methods colorSlider.updateFromRendererResult(rendererResult, histogramResult);
// Round labels to 1 decimal place colorSlider.labelFormatFunction = (value) => value.toFixed(1);
// When the user slides the handle(s), update the renderer // with the updated color visual variable object function changeEventHandler() { const renderer = layer.renderer.clone(); const colorVariable = renderer.visualVariables[0].clone(); const outlineVariable = renderer.visualVariables[1]; colorVariable.stops = colorSlider.stops; renderer.visualVariables = [colorVariable, outlineVariable]; layer.renderer = renderer; }
colorSlider.addEventListener("arcgisThumbChange", changeEventHandler); colorSlider.addEventListener("arcgisThumbDrag", changeEventHandler); colorSlider.addEventListener("arcgisPropertyChange", changeEventHandler);
</script> </body></html>To generate the histogram used by the slider, simply pass similar parameters to the histogram() function. You can then pass the resulting object to the updateFromRendererResult() method.
// Generate a histogram for use in the slider. Input the layer // and field or arcade expression to generate it. const histogramResult = await histogram({ layer: layer, valueExpression: colorParams.valueExpression, view: viewElement.view, numBins: 70, });
// Construct a color slider from the result of both // smart mapping renderer and histogram methods colorSlider.updateFromRendererResult(rendererResult, histogramResult);
// Round labels to 1 decimal place colorSlider.labelFormatFunction = (value) => value.toFixed(1);After the slider is set up with the statistics of the FeatureLayer, you can listen to its events to update the renderer of the layer with the output visual variable in the event object.
// When the user slides the handle(s), update the renderer // with the updated color visual variable object function changeEventHandler() { const renderer = layer.renderer.clone(); const colorVariable = renderer.visualVariables[0].clone(); const outlineVariable = renderer.visualVariables[1]; colorVariable.stops = colorSlider.stops; renderer.visualVariables = [colorVariable, outlineVariable]; layer.renderer = renderer; }
colorSlider.addEventListener("arcgisThumbChange", changeEventHandler); colorSlider.addEventListener("arcgisThumbDrag", changeEventHandler); colorSlider.addEventListener("arcgisPropertyChange", changeEventHandler);A word of caution
Keep in mind that generating renderers should be avoided in most applications because of the performance cost affecting the end user. As stated in the Smart Mapping guide topic, the Smart Mapping APIs were designed for two types of applications: data exploration apps and visualization authoring apps similar to ArcGIS Online. In all other cases, renderers should be saved to the layer or manually created using any of the renderer classes.