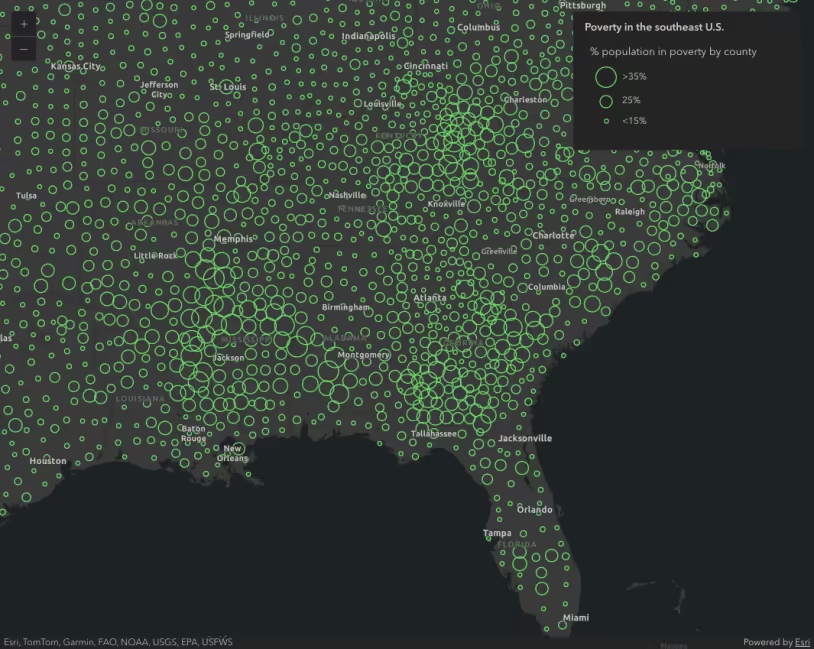
This sample demonstrates how to generate a data-driven continuous size visualization based on statistics returned from a numeric field in a FeatureLayer.
This is accomplished with the createContinuousRenderer() in the size renderer creator helper object. All that is required for generating a renderer is a Feature Layer and a field name.
const sizeParams = { layer: layer, view: viewElement.view, valueExpression: "( $feature.POP_POVERTY / $feature.TOTPOP_CY ) * 100", legendOptions: { title: "% population living in poverty", }, minValue: 15, maxValue: 60, outlineOptimizationEnabled: true, sizeOptimizationEnabled: true, }; // Generate a continuous size renderer based on the // statistics of the data in the provided layer and field. // // This resolves to an object containing several helpful // properties, including size scheme, statistics, // the renderer, and visual variable. let rendererResult = null; sizeRendererCreator .createContinuousRenderer(sizeParams) .then((response) => { // Set the output renderer on the layer. rendererResult = response; layer.renderer = rendererResult.renderer;To generate the histogram used by the slider, simply pass similar parameters to the histogram() function. You can then pass the resulting object to the Size Slider component.
return histogram({ layer: layer, valueExpression: sizeParams.valueExpression, view: viewElement.view, minValue: sizeParams.minValue, maxValue: sizeParams.maxValue, numBins: 30, }); }) .then((histogramResult) => { // Create a size slider from the renderer and histogram result. const sizeSlider = document.querySelector("arcgis-slider-size-legacy"); sizeSlider.updateFromRendererResult(rendererResult, histogramResult); // Color the slider track to match the renderer. const iconColor = rendererResult.renderer.classBreakInfos[0].symbol.color; sizeSlider.sliderStyle.trackFillColor = iconColor; sizeSlider.precision = 1; sizeSlider.histogramConfig.standardDeviation = null; const titleElement = document.getElementById("title"); titleElement.textContent = sizeParams.legendOptions.title;After the slider is set up with the statistics of the FeatureLayer, you can listen to its events to update the renderer of the layer with the output visual variable in the event object.
// When the user slides the handle(s), update the renderer // with the updated color visual variable object. const changeEventHandler = () => { const renderer = layer.renderer.clone(); const sizeVariable = renderer.visualVariables[0]; renderer.visualVariables = [sizeSlider.updateVisualVariable(sizeVariable)]; layer.renderer = renderer; }; sizeSlider.addEventListener("arcgisThumbChange", changeEventHandler); sizeSlider.addEventListener("arcgisThumbDrag", changeEventHandler); }) .catch((error) => { console.error("There was an error: ", error); });A word of caution
Keep in mind that generating renderers should be avoided in most applications because of the performance cost affecting the end user. As stated in the Smart Mapping guide topic, the Smart Mapping APIs were designed for two types of applications: data exploration apps and visualization authoring apps similar to ArcGIS Online. In all other cases, renderers should be saved to the layer or manually created using any of the renderer classes.