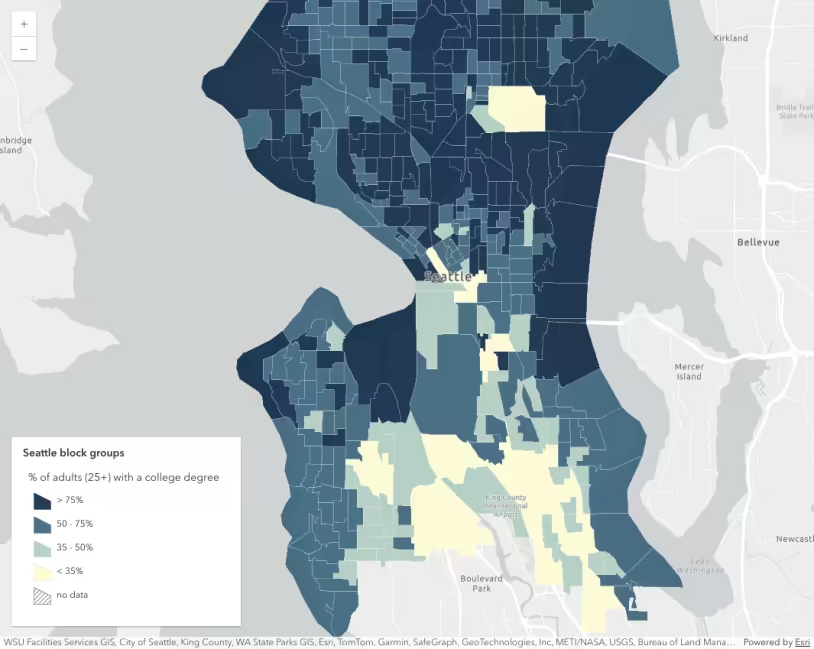
Census tracts styled with a class breaks renderer displaying the level of high school education
What is a class breaks style?
The class breaks style allows you to visualize numeric ranges of data. It involves defining meaningful ranges of numbers into two or more classes, representing each class with a unique symbol. You can use this style to answer questions beginning with how much?
While a class break’s symbol is distinct from another class break’s symbol, symbols are typically similar to one another in all aspects with the exception of one property, such as color.
Class breaks are a good choice to use with percents, rates, ratios and other normalized data because the area or length or size of the feature is irrelevant. By coloring all the features based on their membership in a range of values, it allows direct visual comparison of the features. This works best when the features’ area or length or size does not vary too much.
How a class breaks style works
This style is configured with a class breaks renderer. This renderer requires the following:
- A reference to a data value either from a field name, or an Arcade expression.
- A list of class break info objects that match a unique symbol with a range of expected values returned from the field or expression.
For visualizations with light basemaps or backgrounds, classes representing smaller numbers are typically represented with light colors and classes representing larger numbers are represented with dark colors.
There are several classification methods that can be employed in the creation of this renderer, but defining class breaks in code typically involves manual classification.
Classified visualizations are ideal for maps where predefined breaks hold meaning to the end user. The range for each class and the number of classes should be deliberate choices made after careful consideration.
Examples
Normalize by attribute
This example demonstrates how to visualize ranges of numeric data values normalized by another data attribute. In the vast majority of cases, you should not normalize total counts with polygon data. These values should be normalized by a base value or the area of the polygon.
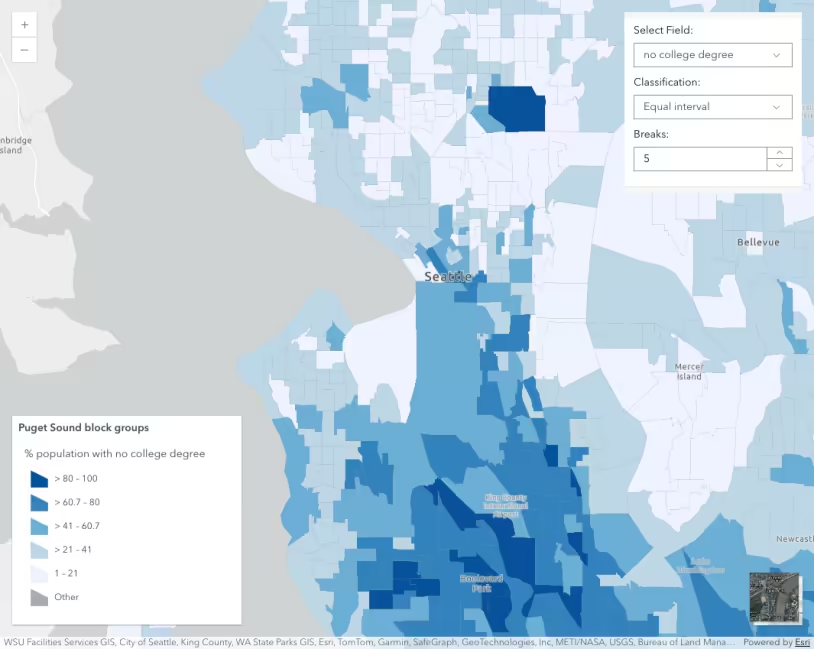
This app visualizes the percentage of people age 25 and older that did not attend any high school classes.
- Create a class breaks renderer
A class breaks renderer is a renderer that classifies numeric data into two or more ranges of values to create a visualization. Each class (or range) is defined by a lower and an upper value and a unique symbol. . - Reference a numeric field name containing the total number of people that did not complete high school.
- Reference a
normalizationField, in this case, the total number of people age 25 and older. The value offieldwill be divided by the value ofnormalizationField. - Create four class break info objects and assign a symbol to each range of values.
- You can optionally add a default symbol to represent all values that don’t fall within one of the breaks.
Pan and zoom the map to explore the level of high school education among adults.
43 collapsed lines
<!doctype html><html> <head> <meta charset="utf-8" /> <meta name="viewport" content="width=device-width, initial-scale=1, shrink-to-fit=no" /> <title>Esri Developer Guide: Class breaks</title>
<link rel="stylesheet" href="https://js.arcgis.com/5.1/esri/themes/light/main.css" /> <!-- Load the ArcGIS Maps SDK for JavaScript from CDN --> <script type="module" src="https://js.arcgis.com/5.1/"></script>
<style> html, body, #viewDiv { height: 100%; margin: 0; } </style>
<script type="module"> const [Map, ClassBreaksRenderer, MapView, FeatureLayer, Legend, Expand] = await $arcgis.import([ "@arcgis/core/Map.js", "@arcgis/core/renderers/ClassBreaksRenderer.js", "@arcgis/core/views/MapView.js", "@arcgis/core/layers/FeatureLayer.js", "@arcgis/core/widgets/Legend.js", "@arcgis/core/widgets/Expand.js", ]);
function createSymbol(color) { return { type: "simple-fill", color, style: "solid", outline: { width: 0.2, color: [255, 255, 255, 0.2], }, }; }
const renderer = new ClassBreaksRenderer({ field: "NOHS_CY", normalizationField: "EDUCBASECY", legendOptions: { title: "% of adults with no high school education", }, defaultSymbol: { type: "simple-fill", color: "black", style: "backward-diagonal", outline: { width: 0.5, color: [50, 50, 50, 0.6], }, }, defaultLabel: "no data", classBreakInfos: [ { minValue: 0, maxValue: 0.04999, symbol: createSymbol("#edf8fb"), label: "< 5%", }, { minValue: 0.05, maxValue: 0.14999, symbol: createSymbol("#b3cde3"), label: "5 - 15%", }, { minValue: 0.15, maxValue: 0.24999, symbol: createSymbol("#8c96c6"), label: "15 - 25%", }, { minValue: 0.25, maxValue: 1.0, symbol: createSymbol("#88419d"), label: "> 25%", }, ], });68 collapsed lines
renderer.visualVariables = [ { type: "size", valueExpression: "$view.scale", target: "outline", stops: [ { size: 2, value: 56187 }, { size: 1, value: 175583 }, { size: 0.5, value: 702332 }, { size: 0, value: 1404664 }, ], }, ];
const layer = new FeatureLayer({ portalItem: { id: "1cbb0faa0f1f424bbe213bfae9319309", }, title: "Census tracts", renderer: renderer, popupTemplate: { content: "{NOHS_CY} adults 25 years old and older in this census tract did not attend high school.", }, opacity: 1, });
const map = new Map({ basemap: { portalItem: { id: "3582b744bba84668b52a16b0b6942544", }, }, layers: [layer], constraints: { snapToZoom: false, }, });
const view = new MapView({ container: "viewDiv", map: map, scale: 577790, center: [-117.8099, 34.0441], });
const legend = new Legend({ view: view, });
view.ui.add( new Expand({ view: view, content: legend, expanded: true, }), "top-right", ); </script> </head>
<body> <div id="viewDiv"></div> </body></html>Normalize by area
This example demonstrates how to visualize ranges of values normalized by the area of each polygon. This app visualizes the number of households per square mile. This value is calculated client-side using an Arcade expression.
- Create a class breaks renderer.
- Write the Arcade expression normalizing by the feature’s area and reference it in the
valueExpressionproperty of the renderer. - Create four class break info objects and assign a symbol to each range of values.
- You can optionally add a default symbol to represent all values that don’t fall within one of the breaks.
$feature.TOTHH_CY / AreaGeodetic($feature, 'square-miles');Pan and zoom the map to explore the number of households per square mile.
43 collapsed lines
<!doctype html><html> <head> <meta charset="utf-8" /> <meta name="viewport" content="width=device-width, initial-scale=1, shrink-to-fit=no" /> <title>Esri Developer Guide: Class breaks-Arcade</title>
<link rel="stylesheet" href="https://js.arcgis.com/5.1/esri/themes/light/main.css" /> <!-- Load the ArcGIS Maps SDK for JavaScript from CDN --> <script type="module" src="https://js.arcgis.com/5.1/"></script>
<style> html, body, #viewDiv { height: 100%; margin: 0; } </style>
<script type="module"> const [Map, ClassBreaksRenderer, MapView, FeatureLayer, Legend, Expand] = await $arcgis.import([ "@arcgis/core/Map.js", "@arcgis/core/renderers/ClassBreaksRenderer.js", "@arcgis/core/views/MapView.js", "@arcgis/core/layers/FeatureLayer.js", "@arcgis/core/widgets/Legend.js", "@arcgis/core/widgets/Expand.js", ]);
function createSymbol(color) { return { type: "simple-fill", color, style: "solid", outline: { width: 0.2, color: [255, 255, 255, 0.2], }, }; }
const renderer = new ClassBreaksRenderer({ valueExpression: `
$feature.TOTHH_CY / AreaGeodetic($feature, 'square-miles');
`, valueExpressionTitle: "Households per square mile", classBreakInfos: [ { minValue: 0, maxValue: 2500, symbol: createSymbol("#edf8fb"), label: "< 2,500", }, { minValue: 2500, maxValue: 5000, symbol: createSymbol("#b3cde3"), label: "2,500 - 5,000", }, { minValue: 5000, maxValue: 10000, symbol: createSymbol("#8c96c6"), label: "5000 - 10,000", }, { minValue: 10000, maxValue: 1000000, symbol: createSymbol("#88419d"), label: "> 10,000", }, ], });61 collapsed lines
const layer = new FeatureLayer({ portalItem: { id: "1cbb0faa0f1f424bbe213bfae9319309", }, title: "Census tracts", renderer: renderer, popupTemplate: { content: "{TOTHH_CY} households are in this census tract.", fieldInfos: [ { fieldName: "TOTHH_CY", format: { places: 0, digitSeparator: true, }, }, ], }, opacity: 1, });
const map = new Map({ basemap: { portalItem: { id: "3582b744bba84668b52a16b0b6942544", }, }, layers: [layer], });
const view = new MapView({ container: "viewDiv", map: map, scale: 577790, center: [-117.8099, 34.0441], constraints: { snapToZoom: false, }, });
const legend = new Legend({ view: view, });
view.ui.add( new Expand({ view: view, content: legend, expanded: true, }), "top-right", ); </script> </head>
<body> <div id="viewDiv"></div> </body></html>Graduated point symbols in 3D
This example visualizes earthquakes on a globe based on their magnitude. The goal of this map is to show the major earthquakes that cause severe damage, the moderate ones that cause damage only to buildings which are not earthquake proof, and small earthquakes that don’t cause any serious damage. A class breaks renderer with three classes based on the magnitude ranges is the most suitable to see these types of earthquakes at a glance.
Steps
- Create three classes for high magnitude earthquakes (greater than 7), moderate magnitude (greater than 5 and less than 7) and small magnitude (less than 5).
- Assign an intuitive symbol to each of the classes.
- Set these classes on a class breaks renderer.
- Assign the renderer to the earthquake layer.
124 collapsed lines
<!doctype html><html> <head> <meta charset="utf-8" /> <meta name="viewport" content="width=device-width, initial-scale=1, shrink-to-fit=no" /> <title>Esri Developer Guide: Class breaks (3D)</title>
<link rel="stylesheet" href="https://js.arcgis.com/5.1/esri/themes/light/main.css" /> <!-- Load the ArcGIS Maps SDK for JavaScript from CDN --> <script type="module" src="https://js.arcgis.com/5.1/"></script>
<style> html, body, #viewDiv { height: 100%; margin: 0; } </style>
<script type="module"> const [Map, GeoJSONLayer, SceneView, Basemap, TileLayer, Legend] = await $arcgis.import([ "@arcgis/core/Map.js", "@arcgis/core/layers/GeoJSONLayer.js", "@arcgis/core/views/SceneView.js", "@arcgis/core/Basemap.js", "@arcgis/core/layers/TileLayer.js", "@arcgis/core/widgets/Legend.js", ]);
const map = new Map({ basemap: new Basemap({ baseLayers: [ new TileLayer({ url: "https://tiles.arcgis.com/tiles/nGt4QxSblgDfeJn9/arcgis/rest/services/VintageShadedRelief/MapServer", opacity: 0.7, minScale: 0, }), ], }), ground: { surfaceColor: [255, 255, 255], }, });
const view = new SceneView({ container: "viewDiv", camera: { position: [-96.22, 15.26, 20000000], heading: 0, tilt: 0, }, map: map, alphaCompositingEnabled: true, environment: { background: { type: "color", color: [0, 0, 0, 0], }, lighting: { date: "Sun Jul 15 2018 21:04:41 GMT+0200 (Central European Summer Time)", }, starsEnabled: false, atmosphereEnabled: false, }, constraints: { altitude: { min: 400000, }, }, });
view.highlights.items[0].fillOpacity = 0; view.highlights.items[0].color = "#ffffff";
const url = "https://earthquake.usgs.gov/earthquakes/feed/v1.0/summary/all_month.geojson";
const earthquakesLayer = new GeoJSONLayer({ url: url, copyright: "USGS Earthquakes", screenSizePerspectiveEnabled: false, title: "Earthquakes in the last 30 days", popupTemplate: { title: "Earthquake Info", content: "Magnitude <b>{mag}</b> {type} hit <b>{place}</b> on <b>{time}</b>", fieldInfos: [ { fieldName: "time", format: { dateFormat: "short-date-short-time", }, }, ], }, });
map.add(earthquakesLayer);
// the symbol for each earthquake class is composed of multiple symbol layers
const baseSymbolLayer = { type: "icon", resource: { primitive: "circle" }, material: { color: [245, 116, 73, 0.9] }, size: 3, };
const secondSymbolLayer = { type: "icon", resource: { primitive: "circle" }, material: { color: [245, 116, 73, 0] }, outline: { color: [245, 116, 73, 0.7], size: 1 }, size: 20, };
const thirdSymbolLayer = { type: "icon", resource: { primitive: "circle" }, material: { color: [245, 116, 73, 0] }, outline: { color: [245, 116, 73, 0.5], size: 1 }, size: 40, };
const renderer = { type: "class-breaks", field: "mag", legendOptions: { title: "Legend", }, classBreakInfos: [ { minValue: -2, maxValue: 5, symbol: { type: "point-3d", symbolLayers: [baseSymbolLayer], }, label: "Magnitude < 5", }, { minValue: 5, maxValue: 7, symbol: { type: "point-3d", symbolLayers: [baseSymbolLayer, secondSymbolLayer], }, label: "Magnitude between 5 and 7", }, { minValue: 7, maxValue: 10, symbol: { type: "point-3d", symbolLayers: [baseSymbolLayer, secondSymbolLayer, thirdSymbolLayer], }, label: "Magnitude larger than 7", }, ], };
earthquakesLayer.renderer = renderer;13 collapsed lines
const legend = new Legend({ view: view, }); view.ui.add(legend, "top-right"); </script> </head>
<body> <div id="viewDiv"></div> </body></html>Related samples and resources
Visualize data with class breaks
Generate a class breaks visualization
MapImageLayer - Explore data from a dynamic workspace
API support
| 2D | 3D | Arcade | Points | Lines | Polygons | Mesh | |
|---|---|---|---|---|---|---|---|
| | | | | | | | |
| | | | | | | | |
| | | | | | | ||
| | | | | | | | |
| | | | | | | | |
| | | | | | | | |
| | | | | | | | |
| | | | | | | | |
| | | | | | | | |
| | | |
- Color only
- Size variable creators only supported for points
- Size variable creators not supported in 3D