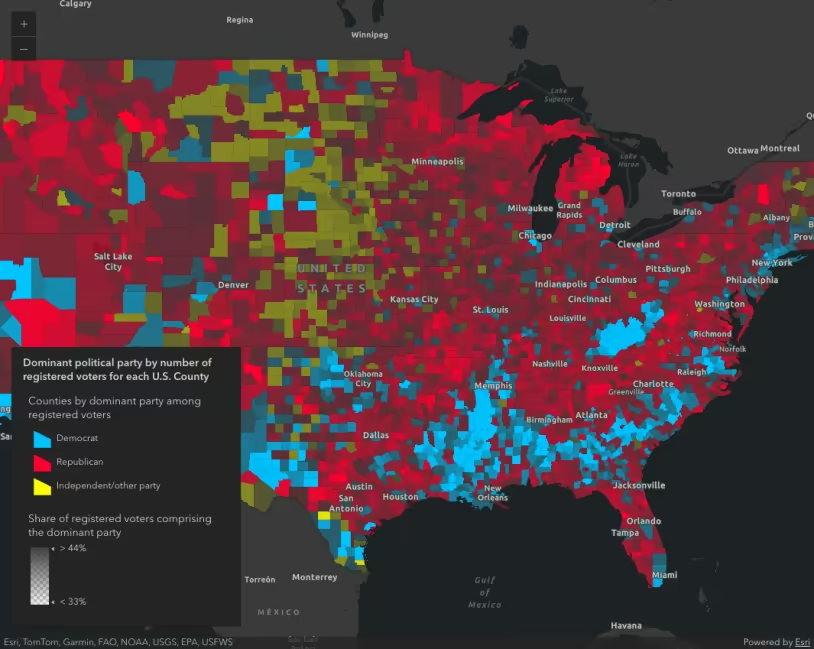
U.S. counties styled with a UniqueValueRenderer showing the predominant political party affiliation of registered voters.
What is Arcade?
Sometimes you need to render an attribute that doesn’t exist in your layer. Arcade
See the Arcade - expression language guide for more details about how to use Arcade in other parts of the ArcGIS Maps SDK for JavaScript
How Arcade works
Arcade expressions are referenced as strings in the valueExpression property of ClassBreaksRenderer, UniqueValueRenderer, DotDensityRenderer or any visual variable: color, size, opacity, and rotation. When defined, it is always used instead of referencing a field/normalizationField.
When used in a ClassBreaksRenderer, DotDensityRenderer, or any of the visual variables, the value expression must evaluate to a number. Expressions may evaluate to either strings or numbers in UniqueValueRenderer.
Examples
Predominance with UniqueValueRenderer
In this example, Arcade is used to create a predominance map showing the most common political party affiliation in each U.S. county. The underlying layer has three fields that identify the number of republicans, democrats, and independent/non-party voters in each county. Since the service does not contain a field indicating the predominant party, we can write an Arcade expression to identify that for each feature.
The Arcade expression is referenced in the valueExpression property of a UniqueValueRenderer.
31 collapsed lines
<!doctype html><html> <head> <meta charset="utf-8" /> <meta name="viewport" content="width=device-width, initial-scale=1, shrink-to-fit=no" />
<title>Create a custom visualization using Arcade</title>
<link rel="stylesheet" href="https://js.arcgis.com/5.1/esri/themes/dark/main.css" /> <!-- Load the ArcGIS Maps SDK for JavaScript from CDN --> <script type="module" src="https://js.arcgis.com/5.1/"></script>
<style> html, body, #viewDiv { height: 100%; margin: 0; } </style>
<script type="module"> const [Map, MapView, FeatureLayer, Legend, Expand] = await $arcgis.import([ "@arcgis/core/Map.js", "@arcgis/core/views/MapView.js", "@arcgis/core/layers/FeatureLayer.js", "@arcgis/core/widgets/Legend.js", "@arcgis/core/widgets/Expand.js", ]);
const renderer = { type: "unique-value", valueExpression: ` // store field values in variables with // meaningful names. Each is the total count // of votes for the respective party
var republican = $feature.MP06025a_B; var democrat = $feature.MP06024a_B; var independent = $feature.MP06026a_B; var parties = [republican, democrat, independent];
// Match the maximum value with the label // of the respective field and return it for // use in a UniqueValueRenderer
return Decode( Max(parties), republican, 'republican', democrat, 'democrat', independent, 'independent', 'n/a' ); `,128 collapsed lines
valueExpressionTitle: "Counties by dominant party among registered voters",
uniqueValueInfos: [ { value: "democrat", symbol: createSymbol("#00c3ff"), label: "Democrat", }, { value: "republican", symbol: createSymbol("#ff002e"), label: "Republican", }, { value: "independent", symbol: createSymbol("#faff00"), label: "Independent/other party", }, ],
};
const layer = new FeatureLayer({ portalItem: { id: "8444e275037549c1acab02d2626daaee", }, renderer, popupTemplate: { title: "{COUNTY}, {STATE}", content: [ { type: "fields", fieldInfos: [ { fieldName: "MP06024a_B", label: "Democrat", fieldFormat: { type: "number", minimumFractionDigits: 0, maximumFractionDigits: 0, useGrouping: "always", }, }, { fieldName: "MP06025a_B", label: "Republican", fieldFormat: { type: "number", minimumFractionDigits: 0, maximumFractionDigits: 0, useGrouping: "always", }, }, { fieldName: "MP06026a_B", label: "Independent/Other", fieldFormat: { type: "number", minimumFractionDigits: 0, maximumFractionDigits: 0, useGrouping: "always", }, }, { fieldName: "POP18UP_CY", label: "Adult Population", fieldFormat: { type: "number", minimumFractionDigits: 0, maximumFractionDigits: 0, useGrouping: "always", }, }, ], }, ], }, });
const map = new Map({ basemap: "dark-gray-vector", layers: [layer], });
const view = new MapView({ container: "viewDiv", map: map, center: [-95, 38], zoom: 4, });
const legend = new Legend({ view: view, layerInfos: [ { layer: layer, title: "Dominant political party by number of registered voters for each U.S. County", }, ], }); view.ui.add( new Expand({ view, content: legend, }), "top-right", );
// Creates a SimpleFillSymbol based on an input color
function createSymbol(color) { return { type: "simple-fill", // autocasts as new SimpleFillSymbol() color: color, outline: { width: 0.2, color: [0, 0, 0, 0.1], }, }; } </script> </head>
<body> <div id="viewDiv"></div> </body></html>Then assign unique symbols for each expected return value in the renderer.
56 collapsed lines
<!doctype html><html> <head> <meta charset="utf-8" /> <meta name="viewport" content="width=device-width, initial-scale=1, shrink-to-fit=no" />
<title>Create a custom visualization using Arcade</title>
<link rel="stylesheet" href="https://js.arcgis.com/5.1/esri/themes/dark/main.css" /> <!-- Load the ArcGIS Maps SDK for JavaScript from CDN --> <script type="module" src="https://js.arcgis.com/5.1/"></script>
<style> html, body, #viewDiv { height: 100%; margin: 0; } </style>
<script type="module"> const [Map, MapView, FeatureLayer, Legend, Expand] = await $arcgis.import([ "@arcgis/core/Map.js", "@arcgis/core/views/MapView.js", "@arcgis/core/layers/FeatureLayer.js", "@arcgis/core/widgets/Legend.js", "@arcgis/core/widgets/Expand.js", ]);
const renderer = { type: "unique-value", valueExpression: ` // store field values in variables with // meaningful names. Each is the total count // of votes for the respective party
var republican = $feature.MP06025a_B; var democrat = $feature.MP06024a_B; var independent = $feature.MP06026a_B; var parties = [republican, democrat, independent];
// Match the maximum value with the label // of the respective field and return it for // use in a UniqueValueRenderer
return Decode( Max(parties), republican, 'republican', democrat, 'democrat', independent, 'independent', 'n/a' ); `,
valueExpressionTitle: "Counties by dominant party among registered voters",
uniqueValueInfos: [ { value: "democrat", symbol: createSymbol("#00c3ff"), label: "Democrat", }, { value: "republican", symbol: createSymbol("#ff002e"), label: "Republican", }, { value: "independent", symbol: createSymbol("#faff00"), label: "Independent/other party", }, ],108 collapsed lines
};
const layer = new FeatureLayer({ portalItem: { id: "8444e275037549c1acab02d2626daaee", }, renderer, popupTemplate: { title: "{COUNTY}, {STATE}", content: [ { type: "fields", fieldInfos: [ { fieldName: "MP06024a_B", label: "Democrat", fieldFormat: { type: "number", minimumFractionDigits: 0, maximumFractionDigits: 0, useGrouping: "always", }, }, { fieldName: "MP06025a_B", label: "Republican", fieldFormat: { type: "number", minimumFractionDigits: 0, maximumFractionDigits: 0, useGrouping: "always", }, }, { fieldName: "MP06026a_B", label: "Independent/Other", fieldFormat: { type: "number", minimumFractionDigits: 0, maximumFractionDigits: 0, useGrouping: "always", }, }, { fieldName: "POP18UP_CY", label: "Adult Population", fieldFormat: { type: "number", minimumFractionDigits: 0, maximumFractionDigits: 0, useGrouping: "always", }, }, ], }, ], }, });
const map = new Map({ basemap: "dark-gray-vector", layers: [layer], });
const view = new MapView({ container: "viewDiv", map: map, center: [-95, 38], zoom: 4, });
const legend = new Legend({ view: view, layerInfos: [ { layer: layer, title: "Dominant political party by number of registered voters for each U.S. County", }, ], }); view.ui.add( new Expand({ view, content: legend, }), "top-right", );
// Creates a SimpleFillSymbol based on an input color
function createSymbol(color) { return { type: "simple-fill", // autocasts as new SimpleFillSymbol() color: color, outline: { width: 0.2, color: [0, 0, 0, 0.1], }, }; } </script> </head>
<body> <div id="viewDiv"></div> </body></html>Arcade-driven opacity
Arcade can be used anywhere a data value is referenced in a renderer, including visual variables. The following snippet references an Arcade expression in an opacity visual variable to calculate the percentage of voters comprising the predominant party in each county. The opacity stops map the expected data values to opacity values.
Opaque counties indicate areas where the predominant political party comprises the vast majority of voters. Transparent counties show areas where there is a more diverse mix of individuals belonging to each political party.
77 collapsed lines
<!doctype html><html> <head> <meta charset="utf-8" /> <meta name="viewport" content="width=device-width, initial-scale=1, shrink-to-fit=no" />
<title>Create a custom visualization using Arcade</title>
<link rel="stylesheet" href="https://js.arcgis.com/5.1/esri/themes/dark/main.css" /> <!-- Load the ArcGIS Maps SDK for JavaScript from CDN --> <script type="module" src="https://js.arcgis.com/5.1/"></script>
<style> html, body, #viewDiv { height: 100%; margin: 0; } </style>
<script type="module"> const [Map, MapView, FeatureLayer, Legend, Expand] = await $arcgis.import([ "@arcgis/core/Map.js", "@arcgis/core/views/MapView.js", "@arcgis/core/layers/FeatureLayer.js", "@arcgis/core/widgets/Legend.js", "@arcgis/core/widgets/Expand.js", ]);
const renderer = { type: "unique-value", valueExpression: ` // store field values in variables with // meaningful names. Each is the total count // of votes for the respective party
var republican = $feature.MP06025a_B; var democrat = $feature.MP06024a_B; var independent = $feature.MP06026a_B; var parties = [republican, democrat, independent];
// Match the maximum value with the label // of the respective field and return it for // use in a UniqueValueRenderer
return Decode( Max(parties), republican, 'republican', democrat, 'democrat', independent, 'independent', 'n/a' ); `,
valueExpressionTitle: "Counties by dominant party among registered voters",
uniqueValueInfos: [ { value: "democrat", symbol: createSymbol("#00c3ff"), label: "Democrat", }, { value: "republican", symbol: createSymbol("#ff002e"), label: "Republican", }, { value: "independent", symbol: createSymbol("#faff00"), label: "Independent/other party", }, ],
};
renderer.visualVariables = [ { type: "opacity", valueExpression: ` var republican = $feature.MP06025a_B; var democrat = $feature.MP06024a_B; var independent = $feature.MP06026a_B; var parties = [republican, democrat, independent]; var total = Sum(parties); var max = Max(parties);
return (max / total) * 100; `, valueExpressionTitle: "Share of registered voters comprising the dominant party", stops: [ { value: 33, opacity: 0.05, label: "< 33%" }, { value: 44, opacity: 1.0, label: "> 44%" }, ], }, ];107 collapsed lines
const layer = new FeatureLayer({ portalItem: { id: "8444e275037549c1acab02d2626daaee", }, renderer, popupTemplate: { title: "{COUNTY}, {STATE}", content: [ { type: "fields", fieldInfos: [ { fieldName: "MP06024a_B", label: "Democrat", fieldFormat: { type: "number", minimumFractionDigits: 0, maximumFractionDigits: 0, useGrouping: "always", }, }, { fieldName: "MP06025a_B", label: "Republican", fieldFormat: { type: "number", minimumFractionDigits: 0, maximumFractionDigits: 0, useGrouping: "always", }, }, { fieldName: "MP06026a_B", label: "Independent/Other", fieldFormat: { type: "number", minimumFractionDigits: 0, maximumFractionDigits: 0, useGrouping: "always", }, }, { fieldName: "POP18UP_CY", label: "Adult Population", fieldFormat: { type: "number", minimumFractionDigits: 0, maximumFractionDigits: 0, useGrouping: "always", }, }, ], }, ], }, });
const map = new Map({ basemap: "dark-gray-vector", layers: [layer], });
const view = new MapView({ container: "viewDiv", map: map, center: [-95, 38], zoom: 4, });
const legend = new Legend({ view: view, layerInfos: [ { layer: layer, title: "Dominant political party by number of registered voters for each U.S. County", }, ], }); view.ui.add( new Expand({ view, content: legend, }), "top-right", );
// Creates a SimpleFillSymbol based on an input color
function createSymbol(color) { return { type: "simple-fill", // autocasts as new SimpleFillSymbol() color: color, outline: { width: 0.2, color: [0, 0, 0, 0.1], }, }; } </script> </head>
<body> <div id="viewDiv"></div> </body></html>See the Arcade - expression language guide for more details about how to use Arcade in other parts of the ArcGIS Maps SDK for JavaScript