ArcGIS Maps SDK for JavaScript components are a collection of pre-built UI components for building web apps with minimal code.
Built as standards-based web components, they extend the JavaScript Maps SDK core API into reusable custom HTML elements, such as <arcgis-map. They are available on the ArcGIS CDN and npm.
They are also designed to be JavaScript framework agnostic, so you can use them in applications built with vanilla JavaScript or with most frameworks and module bundlers.
With the current release, there are three component packages: map, charts (beta) and coding components.
Map components
The @arcgis/map-components package contains the map component, the scene component, and other components with functionality equivalent to SDK's existing widgets.
These components are an alternative option for quickly building mapping apps when integrating with frameworks. Here is a code snippet to demonstrate the basic concept:
<arcgis-map item-id="05e015c5f0314db9a487a9b46cb37eca"></arcgis-map>Charts components (beta)
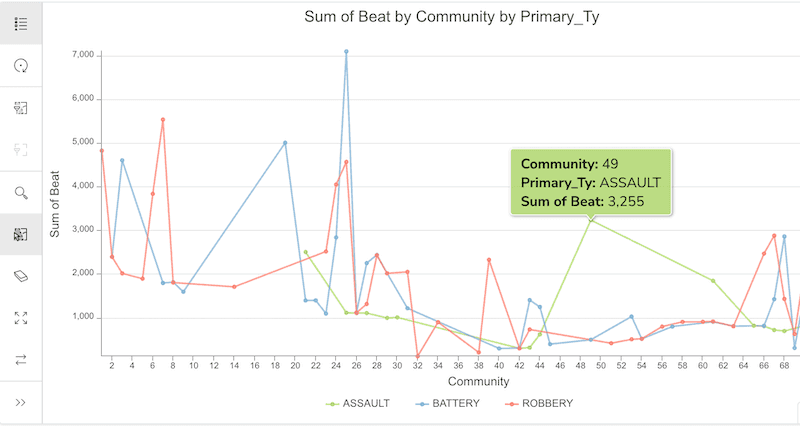
The @arcgis/charts-components package contains a series of components that can be used to build charts in your ArcGIS Maps SDK for JavaScript applications.
When used alongside maps, they can provide a complete data visualization story of your data. Currently, eight different types of chart components are available.
Each chart component can be rendered by referring to a JSON object that follows a common chart specification, which contains the configuration for the chart.
The @arcgis/charts-model package can be used to ease the creation and updating of that chart's configuration.

Coding components
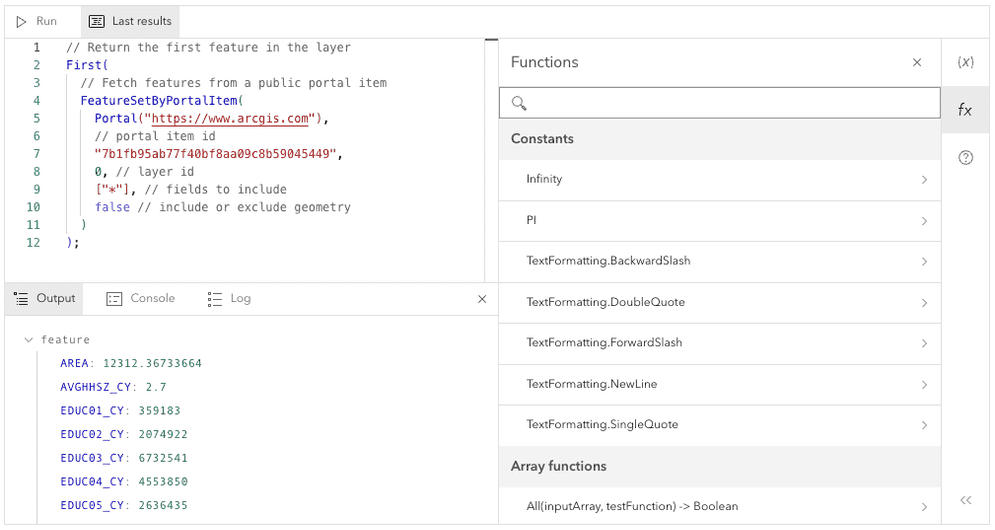
The @arcgis/coding-components package contains the Arcade editor component. With this component, end users can create Arcade expressions for the purpose of dynamically create new data values for renderers, popups and labels.
Users will have the same experience editing their Arcade expressions as they do in Map Viewer and the Arcade playground.
