Incidents styled with a simple render, visual variables, and clusters to show number of days to close
What are time styles?
Time styles include all visualizations that involve date/time data. You can use these styles to visualize when and where an event occurs. Common examples involve the following:
- Timeline
- Before and after
- Age
- Track visualization
- Time series animation
Examples
Timeline
A timeline visualization displays date/time data along a continuous color ramp. It provides an immediate view at when phenomena occurred or when a value was recorded relative to all other data points.
The following example visualizes hurricane locations in the Atlantic Ocean recorded in the year 2000. This uses a color visual variable to show which hurricanes occurred early in the season versus late in the season.
Pan and zoom the map to explore the date and location of observed hurricanes.
43 collapsed lines
<!doctype html><html> <head> <meta charset="utf-8" /> <meta name="viewport" content="width=device-width, initial-scale=1, shrink-to-fit=no" />
<title>Esri Developer Guide: Hurricane location and timeline</title>
<link rel="stylesheet" href="https://js.arcgis.com/5.1/esri/themes/light/main.css" /> <!-- Load the ArcGIS Maps SDK for JavaScript from CDN --> <script type="module" src="https://js.arcgis.com/5.1/"></script>
<style> html, body, #viewDiv { height: 100%; margin: 0; } </style>
<script type="module"> const [WebMap, MapView, FeatureLayer, Legend, Expand] = await $arcgis.import([ "@arcgis/core/WebMap.js", "@arcgis/core/views/MapView.js", "@arcgis/core/layers/FeatureLayer.js", "@arcgis/core/widgets/Legend.js", "@arcgis/core/widgets/Expand.js", ]);
const renderer = { type: "simple", label: "Observed hurricane location", symbol: { type: "simple-marker", size: 6, outline: { width: 0.5, color: [255, 255, 255, 0.5], }, },
visualVariables: [ { type: "color", field: "Date_Time", legendOptions: { title: "Date of observation", }, stops: [ { value: new Date(2000, 7, 3).getTime(), color: "#00ffff" }, { value: new Date(2000, 9, 22).getTime(), color: "#2f3f56" }, ], }, ],43 collapsed lines
};
const layer = new FeatureLayer({ url: "https://sampleserver6.arcgisonline.com/arcgis/rest/services/Hurricanes/MapServer/0", renderer: renderer, });
const map = new WebMap({ portalItem: { id: "9cf503b654144873a8e33f996f91ba1d", }, layers: [layer], });
const view = new MapView({ container: "viewDiv", map: map, scale: 36978595, center: [-44.0632, 33.1567], constraints: { snapToZoom: false, }, });
view.ui.add( new Expand({ content: new Legend({ view: view, }), view: view, expanded: true, }), "top-right", ); </script> </head>
<body> <div id="viewDiv"></div> </body></html>Before and after
You can use a color visual variable with a diverging color ramp to visualize which events occurred before and after a specific date.
The following example visualizes clusters of hurricane locations summarized by whether they occurred before or after July 1st.
Pan and zoom the map to explore clusters of hurricane locations and the year of their occurrence.
41 collapsed lines
<!doctype html><html> <head> <meta charset="utf-8" /> <meta name="viewport" content="width=device-width, initial-scale=1, shrink-to-fit=no" />
<title>Esri Developer Guide: Hurricane locations before or after 1977</title>
<link rel="stylesheet" href="https://js.arcgis.com/5.1/esri/themes/light/main.css" /> <!-- Load the ArcGIS Maps SDK for JavaScript from CDN --> <script type="module" src="https://js.arcgis.com/5.1/"></script>
<style> html, body, #viewDiv { height: 100%; margin: 0; } </style>
<script type="module"> const [WebMap, MapView, FeatureLayer, Legend, Expand] = await $arcgis.import([ "@arcgis/core/WebMap.js", "@arcgis/core/views/MapView.js", "@arcgis/core/layers/FeatureLayer.js", "@arcgis/core/widgets/Legend.js", "@arcgis/core/widgets/Expand.js", ]);
const colors = ["#54bebe", "#dedad2", "#c80064"]; const renderer = { type: "simple", label: "Observed hurricane location", symbol: { type: "simple-marker", size: 4, outline: null, },
visualVariables: [ { type: "color", field: "ISO_time", legendOptions: { title: "Before and after July 1", }, stops: [ { value: new Date(2013, 0, 1).getTime(), color: colors[0], label: "January 1" }, { value: new Date(2013, 6, 1).getTime(), color: colors[1], label: "July 1" }, { value: new Date(2013, 11, 31).getTime(), color: colors[2], label: "December 31" }, ], }, ],51 collapsed lines
};
// ISO_time
const layer = new FeatureLayer({ title: "2013 Hurricane season", portalItem: { id: "f14573e9c5ce4b41aecb199d5723209b", }, renderer: renderer, definitionExpression: "Season = 2013", });
const map = new WebMap({ basemap: { portalItem: { id: "3967a92f547341e28636a8ac159666a3", }, }, layers: [layer], });
const view = new MapView({ container: "viewDiv", map: map, scale: 136195673, constraints: { snapToZoom: false, rotationEnabled: false, }, });
view.ui.add( new Expand({ content: new Legend({ view: view, }), view: view, expanded: true, }), "top-right", ); </script> </head>
<body> <div id="viewDiv"></div> </body></html>Age
An age visualization shows the age of a feature (or the elapsed time up to a meaningful date or the current date) based on a date field. Age visualizations may be applied in the following scenarios:
- How long has an asset been in commission?
- How old is the incident report?
- How long has it been since the last inspection?
- Is an incident past due for resolution?
Age is typically defined using the DateDiff function in an Arcade expression and mapped with a color or size variable. It specifies a length of time with desired units.
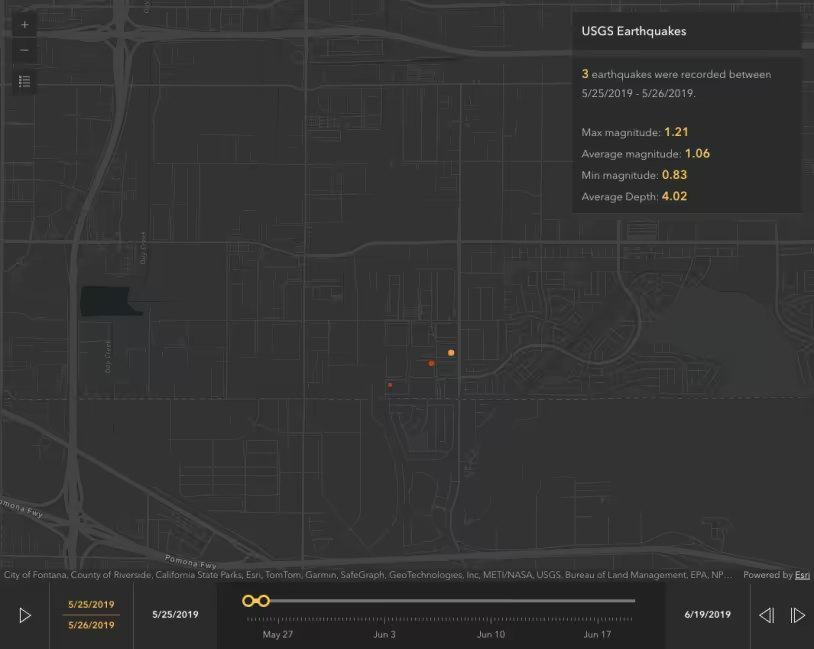
valueExpression = "DateDiff( Now(), $feature.date_created, 'hours' )";The following example visualizes clustered street condition complaints in New York City based on how much time passed before the incident was closed relative to its due date.
Pan and zoom the map to explore the number of street condition complaints and the mount of time it took to close the incident.
48 collapsed lines
<!doctype html><html> <head> <meta charset="utf-8" /> <meta name="viewport" content="width=device-width, initial-scale=1, shrink-to-fit=no" />
<title>Esri Developer Guide: Street condition complaints</title>
<link rel="stylesheet" href="https://js.arcgis.com/5.1/esri/themes/light/main.css" /> <!-- Load the ArcGIS Maps SDK for JavaScript from CDN --> <script type="module" src="https://js.arcgis.com/5.1/"></script>
<style> html, body, #viewDiv { height: 100%; margin: 0; } </style>
<script type="module"> const [WebMap, MapView, FeatureLayer, Legend, Expand, clusterLabelCreator, clusterPopupCreator, promiseUtils] = await $arcgis.import([ "@arcgis/core/WebMap.js", "@arcgis/core/views/MapView.js", "@arcgis/core/layers/FeatureLayer.js", "@arcgis/core/widgets/Legend.js", "@arcgis/core/widgets/Expand.js", "@arcgis/core/smartMapping/labels/clusters.js", "@arcgis/core/smartMapping/popup/clusters.js", "@arcgis/core/core/promiseUtils.js", ]);
const colors = ["#2799ff", "#423a3a", "#ff3333"]; const renderer = { type: "simple", label: "Observed hurricane location", symbol: { type: "simple-marker", size: 6, outline: { width: 0.5, color: [255, 255, 255, 0.5], }, },
visualVariables: [ { type: "color", valueExpression: "DateDiff($feature['closed_time'], $feature['due_time'], 'days')", valueExpressionTitle: "Days it took to close incident", stops: [ { value: -21, color: colors[0], label: "21 weeks early" }, { value: 0, color: colors[1], label: "On time" }, { value: 21, color: colors[2], label: "21 weeks late" }, ], }, ],97 collapsed lines
};
const layer = new FeatureLayer({ portalItem: { id: "f624a9f4afa947fe98acd0ed38fbe436", }, title: "Street condition complaints", renderer: renderer, definitionExpression: "Complaint_Type = 'Street Condition'", });
const map = new WebMap({ portalItem: { id: "75a3ce8990674a5ebd5b9ab66bdab893", }, layers: [layer], });
const view = new MapView({ container: "viewDiv", map: map, scale: 144447, center: [-73.863, 40.7], constraints: { snapToZoom: false, }, });
view.ui.add( new Expand({ content: new Legend({ view: view, }), view: view, expanded: true, }), "top-right", );
view .when() .then(generateClusterConfig) .then(function (featureReduction) { layer.featureReduction = featureReduction; });
function generateClusterConfig() { // generates default popupTemplate const popupPromise = clusterPopupCreator .getTemplates({ layer: layer, }) .then(function (popupTemplateResponse) { return popupTemplateResponse.primaryTemplate.value; });
// generates default labelingInfo const labelPromise = clusterLabelCreator .getLabelSchemes({ layer: layer, view: view, }) .then(function (labelSchemes) { return labelSchemes.primaryScheme; });
return promiseUtils .eachAlways([popupPromise, labelPromise]) .then(function (result) { const popupTemplate = result[0].value;
const primaryLabelScheme = result[1].value; const labelingInfo = primaryLabelScheme.labelingInfo; // Ensures the clusters are large enough to fit labels const clusterMinSize = primaryLabelScheme.clusterMinSize;
return { type: "cluster", popupTemplate: popupTemplate, labelingInfo: labelingInfo, clusterMinSize: clusterMinSize, clusterRadius: 50, }; }) .catch(function (error) { console.error(error); }); } </script> </head>
<body> <div id="viewDiv"></div> </body></html>Track visualization
Track data is represented as a series of observations (typically points). In addition to a timestamp, each observation must belong to a track identified by a unique ID. This ID is used to group observations into a track. To render track data, the layer must be configured with a valid timeInfo.
The timeInfo property of the layer defines the following:
- startField: The field representing the time the observation occurred.
- trackIdField: The field containing the unique ID of the track the observation belongs to.
layer.timeInfo = { startField: "ISO_time", trackIdField: "Serial_Num",};The layer in this example represents historic hurricane locations as points. To render each hurricane tracks as paths, you must also set the trackInfo property of the layer. The trackInfo property defines the following properties:
- previousObservations: Defines how to render the previous observations of the track. In this example, previous locations are rendered as simple markers with color and size visual variables to indicate the strength of the hurricane.
- latestObservations: Defines how to render the latest observations of the track relative to the time slider. In this example, the latest hurricane observations are rendered as animated markers resembling a hurricane’s shape with a size visual variable to indicate the strength of the hurricane.
- trackLine: Defines how to render the track line. In this example, the track line is rendered as a simple line.
The renderers listed above also include opacity visual variables to indicate the age of the observation relative to the time slider. The older the observation, the more transparent it appears until it fades out completely.
This requires a TimeSlider component for control over the time.
Click the play button to show previous positions of hurricanes relative to the time slider.
The basic trackInfo configuration is stubbed out below. Open the code editor above to see the full configuration.
layer.trackInfo = { previousObservations: { renderer: { // renderer configuration defined here }, labelingInfo: [ // labelingInfo configuration defined here ], }, latestObservations: { renderer: { // renderer configuration defined here }, labelingInfo: [ // labelingInfo configuration defined here ], }, trackLine: { renderer: { // renderer configuration defined here }, labelingInfo: [ // labelingInfo configuration defined here ], },};Time series animation
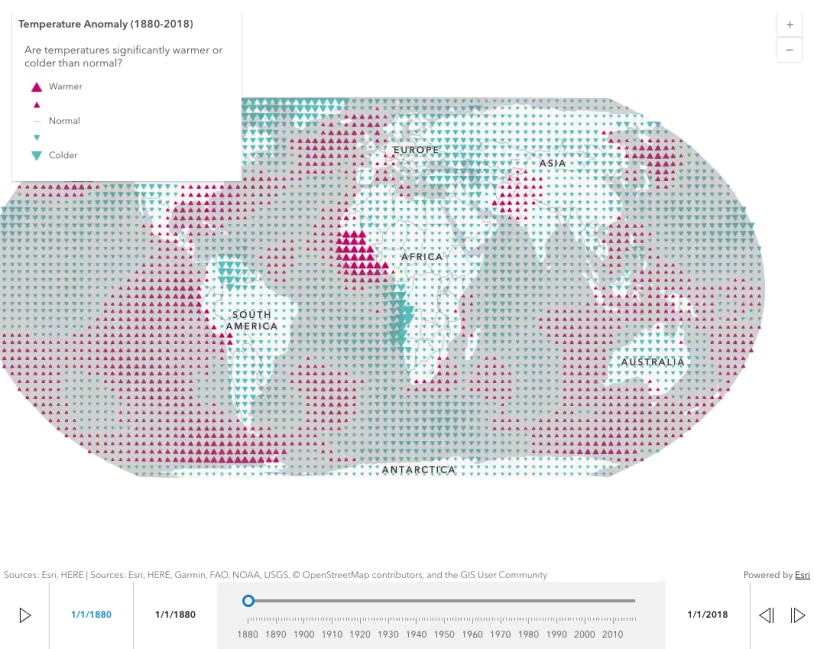
Time series animations are visualizations showing how data values change over time in features fixed at unchanging locations. These typically involve a time slider so users have the ability to explore moments of time or time windows.
For features that have a static position (such as sensors, buildings, countries, etc.), but have attributes that vary over time (e.g. POPULATION_2000, POPULATION_2005, POPULATION_2010, etc.), Arcade expressions can access time slider values to dynamically reference the field name corresponding to the current time on the slider. This allows you to visualize how data changes over time without needing to filter features or download duplicate geometries.
In this example, the temperature anomaly layer has field names representing temperature anomalies for each year from 1880 to 2020 in this format: F1900, F1901, F1902, …, F2020. The Arcade expression uses the time slider value to dynamically reference the field name for the year represented by the slider value.
The underlying rendering engine re-executes the expression with every slider value change.
Use the slider to demonstrate temperature anomaly changes over time.
First, configure the time slider to match the start and end dates of the data with the appropriate time interval.
23 collapsed lines
<!doctype html><html lang="en"> <head> <meta charset="utf-8" /> <meta name="viewport" content="width=device-width, initial-scale=1, shrink-to-fit=no" /> <title>Esri Developer Guide: Time series animation</title>
<!-- Load the ArcGIS Maps SDK for JavaScript from CDN --> <script type="module" src="https://js.arcgis.com/5.1/"></script> </head>
<body> <calcite-shell> <arcgis-map item-id="74a5a5d2e6784ef19578cbce8c808886"> <arcgis-legend slot="top-left"></arcgis-legend> </arcgis-map> <calcite-shell-panel id="slider-panel" slot="panel-bottom"> <arcgis-time-slider layout="auto" mode="instant" reference-element="arcgis-map"></arcgis-time-slider> </calcite-shell-panel> </calcite-shell>
<script type="module">
const yearSlider = document.querySelector("arcgis-time-slider"); yearSlider.fullTimeExtent = { start: new Date(1880, 0, 1), end: new Date(2018, 0, 1), }; yearSlider.timeExtent = { start: new Date(1880, 0, 1), end: new Date(1880, 0, 1), }; yearSlider.stops = { interval: { value: 1, unit: "years", }, };52 collapsed lines
const viewElement = document.querySelector("arcgis-map"); viewElement.timeExtent = yearSlider.timeExtent;
viewElement.addEventListener("arcgisViewReadyChange", async () => { const view = viewElement.view; const layer = view.map.layers.getItemAt(0); const renderer = layer.renderer.clone(); // Updates the underlying data value driving the expression // based on the given year provided by the slider
const sizeVisualVariable = renderer.visualVariables.find((visualVariable) => visualVariable.type === "size");
// Returns the value of the "F{year}" field based on the slider's value. // This expression will re-execute every time the slider's value changes const valueExpression = ` Expects($feature, "F*"); if(HasValue($view, ["timeProperties", "currentEnd"])){ var y = Year($view.timeProperties.currentEnd); var value = $feature["F" + y]; return value; } return null; `;
// Update legend text to be more user friendly const valueExpressionTitle = "Are temperatures significantly warmer or colder than normal?";
// Replace the field with the valueExpression so the user can dynamically // explore the data as it changed from year to year renderer.field = null; renderer.valueExpression = valueExpression; renderer.valueExpressionTitle = valueExpressionTitle;
// Since this is an above-and-below size renderer, we need to update // the size visual variable to reflect the new valueExpression sizeVisualVariable.field = null; sizeVisualVariable.valueExpression = valueExpression; sizeVisualVariable.valueExpressionTitle = valueExpressionTitle; // Update legend text to be more user friendly sizeVisualVariable.stops[0].label = "Colder"; sizeVisualVariable.stops[2].label = "Normal"; sizeVisualVariable.stops[4].label = "Warmer";
renderer.visualVariables = [sizeVisualVariable]; layer.renderer = renderer; }); </script> </body></html>Next, update the layer’s renderer to use an Arcade expression that references the time slider value to dynamically access the field name for the year represented by the slider value.
50 collapsed lines
<!doctype html><html lang="en"> <head> <meta charset="utf-8" /> <meta name="viewport" content="width=device-width, initial-scale=1, shrink-to-fit=no" /> <title>Esri Developer Guide: Time series animation</title>
<!-- Load the ArcGIS Maps SDK for JavaScript from CDN --> <script type="module" src="https://js.arcgis.com/5.1/"></script> </head>
<body> <calcite-shell> <arcgis-map item-id="74a5a5d2e6784ef19578cbce8c808886"> <arcgis-legend slot="top-left"></arcgis-legend> </arcgis-map> <calcite-shell-panel id="slider-panel" slot="panel-bottom"> <arcgis-time-slider layout="auto" mode="instant" reference-element="arcgis-map"></arcgis-time-slider> </calcite-shell-panel> </calcite-shell>
<script type="module">
const yearSlider = document.querySelector("arcgis-time-slider"); yearSlider.fullTimeExtent = { start: new Date(1880, 0, 1), end: new Date(2018, 0, 1), }; yearSlider.timeExtent = { start: new Date(1880, 0, 1), end: new Date(1880, 0, 1), }; yearSlider.stops = { interval: { value: 1, unit: "years", }, };
const viewElement = document.querySelector("arcgis-map"); viewElement.timeExtent = yearSlider.timeExtent;
viewElement.addEventListener("arcgisViewReadyChange", async () => { const view = viewElement.view; const layer = view.map.layers.getItemAt(0); const renderer = layer.renderer.clone(); // Updates the underlying data value driving the expression // based on the given year provided by the slider
const sizeVisualVariable = renderer.visualVariables.find((visualVariable) => visualVariable.type === "size");
// Returns the value of the "F{year}" field based on the slider's value. // This expression will re-execute every time the slider's value changes const valueExpression = ` Expects($feature, "F*"); if(HasValue($view, ["timeProperties", "currentEnd"])){ var y = Year($view.timeProperties.currentEnd); var value = $feature["F" + y]; return value; } return null; `;27 collapsed lines
// Update legend text to be more user friendly const valueExpressionTitle = "Are temperatures significantly warmer or colder than normal?";
// Replace the field with the valueExpression so the user can dynamically // explore the data as it changed from year to year renderer.field = null; renderer.valueExpression = valueExpression; renderer.valueExpressionTitle = valueExpressionTitle;
// Since this is an above-and-below size renderer, we need to update // the size visual variable to reflect the new valueExpression sizeVisualVariable.field = null; sizeVisualVariable.valueExpression = valueExpression; sizeVisualVariable.valueExpressionTitle = valueExpressionTitle; // Update legend text to be more user friendly sizeVisualVariable.stops[0].label = "Colder"; sizeVisualVariable.stops[2].label = "Normal"; sizeVisualVariable.stops[4].label = "Warmer";
renderer.visualVariables = [sizeVisualVariable]; layer.renderer = renderer; }); </script> </body></html>Related samples and resources
Filter features with TimeSlider component
TimeSlider component
TimeSlider with timeOffset and actions
Animate color visual variable
Update a renderer's attribute
Six ways to visualize change over time in web maps
API support
| 2D | 3D | Arcade | Points | Lines | Polygons | Mesh | |
|---|---|---|---|---|---|---|---|
| | | | | | | | |
| | | | | | | | |
| | | | | | | ||
| | | | | | | | |
| | | | | | | | |
| | | | | | | | |
| | | | | | | | |
| | | | | | | | |
| | | | | | | | |
| | | |
- Color only
- Size variable creators only supported for points
- Size variable creators not supported in 3D