Census tracts styled with a unique value renderer, visual variables, and an Arcade expression to show income by predominant educational attainment
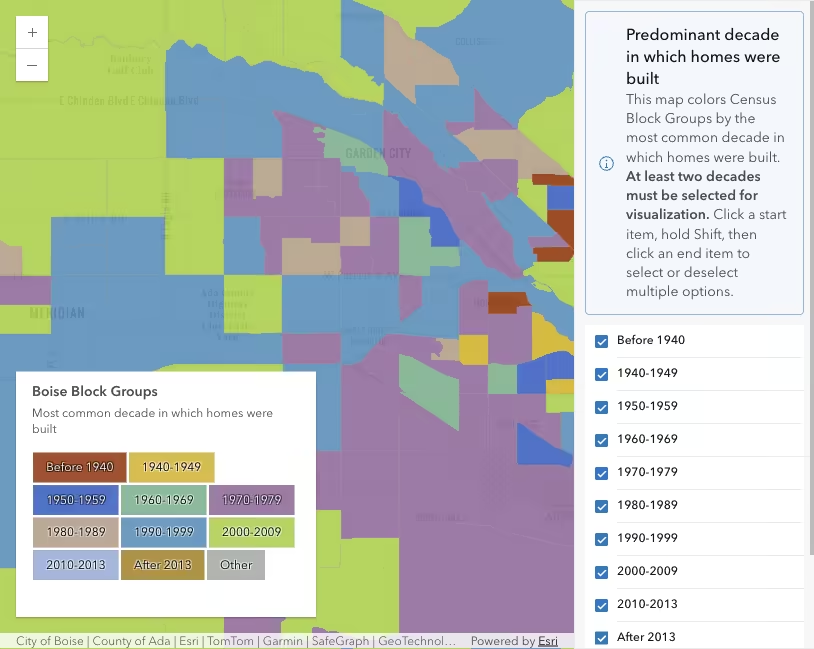
What is a predominance style?
A predominance style colors features based on the category with the highest (or predominant) number among a set of similar categories. You can use this style to map anything that involves sub-categories of a larger population.
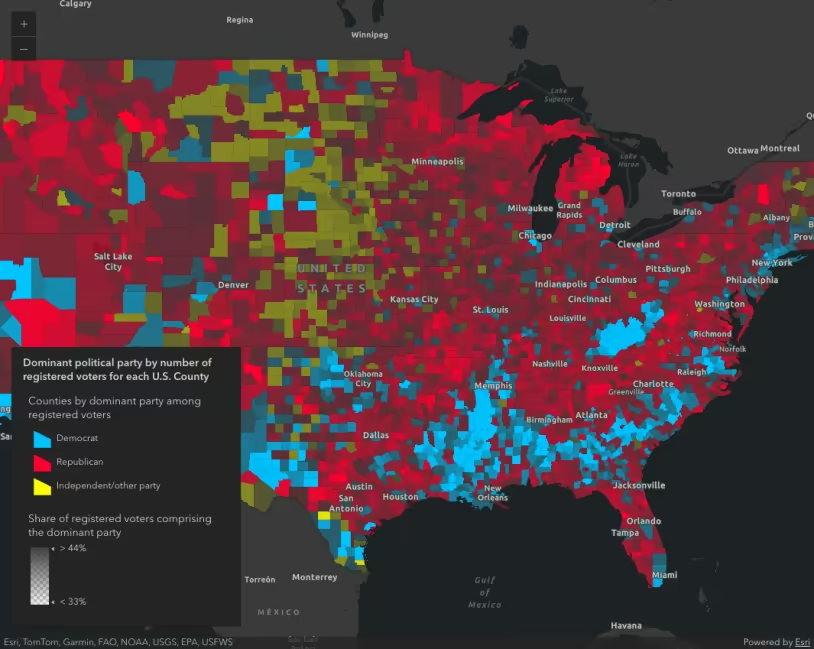
- The winner of an election
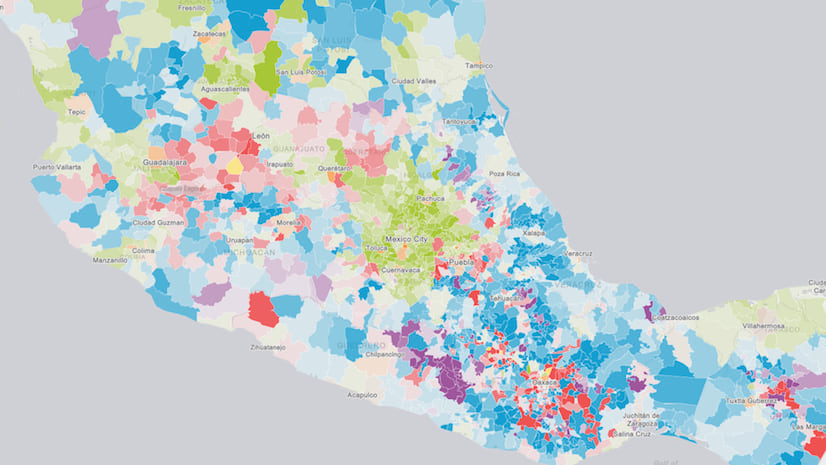
- The predominant language spoken at home
- The most common race/ethnicity in a region
How a predominance style works
This style requires writing an Arcade expression that returns the category with the largest number. The following expression returns a string for the predominant educational attainment level for a given feature.
17 collapsed lines
<!doctype html><html> <head> <meta charset="utf-8" /> <meta name="viewport" content="width=device-width, initial-scale=1, shrink-to-fit=no" /> <title>Esri Developer Guide: Predominance educational attainment</title>
<link rel="stylesheet" href="https://js.arcgis.com/5.1/esri/themes/light/main.css" /> <!-- Load the ArcGIS Maps SDK for JavaScript from CDN --> <script type="module" src="https://js.arcgis.com/5.1/"></script>
<!-- ARCADE SCRIPTS -->
<!-- PREDOMINANT POLITICAL PARTY -->
<script type="text/plain" id="predominance">
// store field values in variables with // meaningful names. Each is the total count // of people that attained each education level
var noHighSchool = $feature.NOHS_CY; var someHighSchool = $feature.SOMEHS_CY; var highSchool = $feature.HSGRAD_CY; var ged = $feature.GED_CY; var someCollege = $feature.SMCOLL_CY; var associates = $feature.ASSCDEG_CY; var bachelors = $feature.BACHDEG_CY; var grad = $feature.GRADDEG_CY;
var all = [ noHighSchool, someHighSchool, highSchool, ged, someCollege, associates, bachelors, grad, ];
// Match the maximum value with the label // of the respective field and return it for // use in a UniqueValueRenderer
return Decode( Max(all), noHighSchool, 'No high school', someHighSchool, 'Some high school', highSchool, 'High school diploma', ged, 'GED', someCollege, 'Some college', associates, 'Associate\'s degree', bachelors, 'Bachelor\'s degree', grad, 'Master\'s degree or higher', 'n/a' );118 collapsed lines
</script>
<script type="module"> const [WebMap, MapView, FeatureLayer, Legend, Expand] = await $arcgis.import([ "@arcgis/core/WebMap.js", "@arcgis/core/views/MapView.js", "@arcgis/core/layers/FeatureLayer.js", "@arcgis/core/widgets/Legend.js", "@arcgis/core/widgets/Expand.js", ]);
function createSymbol(color) { return { type: "simple-fill", color: color, outline: { width: 0.3, color: [255, 255, 255, 0.2], }, }; }
const colors = ["#00b6f1", "#d9bf0d", "#6a28c7", "#c44245", "#b9a087", "#ab579d", "#78aea0", "#1e8553"]; const predominanceArcade = document.getElementById("predominance").text; const renderer = { type: "unique-value", valueExpression: predominanceArcade, valueExpressionTitle: "Predominant educational attainment", uniqueValueInfos: [ { value: "Master's degree or higher", symbol: createSymbol(colors[0]), }, { value: "Bachelor's degree", symbol: createSymbol(colors[1]), }, { value: "Associate's degree", symbol: createSymbol(colors[2]), }, { value: "Some college", symbol: createSymbol(colors[3]), }, { value: "GED", symbol: createSymbol(colors[4]), }, { value: "High school diploma", symbol: createSymbol(colors[5]), }, { value: "Some high school", symbol: createSymbol(colors[6]), }, { value: "No high school", symbol: createSymbol(colors[7]), }, ], };
const layer = new FeatureLayer({ portalItem: { id: "1cbb0faa0f1f424bbe213bfae9319309", }, renderer: renderer, blendMode: "multiply", });
const map = new WebMap({ portalItem: { id: "9cf503b654144873a8e33f996f91ba1d", }, layers: [layer], });
const view = new MapView({ container: "viewDiv", map: map, scale: 577790, center: [-117.8099, 34.0441], constraints: { snapToZoom: false, }, });
view.ui.add( new Expand({ content: new Legend({ view: view, }), view: view, expanded: false, }), "top-right", ); </script>
<style> html, body, #viewDiv { height: 100%; margin: 0; } </style> </head>
<body> <div id="viewDiv"></div> </body></html>Once the expression is authored, create a unique value renderer and set the following:
- Reference the Arcade expression in the
valueExpressionproperty. - Create unique value info objects for each of the expected values returned from the expression.
Examples
Predominant value
The following example colors each census tract based on the predominant educational attainment of adults age 25 years or older.
Pan and zoom the map to explore the predominance of education attainment.
74 collapsed lines
<!doctype html><html> <head> <meta charset="utf-8" /> <meta name="viewport" content="width=device-width, initial-scale=1, shrink-to-fit=no" /> <title>Esri Developer Guide: Predominance educational attainment</title>
<link rel="stylesheet" href="https://js.arcgis.com/5.1/esri/themes/light/main.css" /> <!-- Load the ArcGIS Maps SDK for JavaScript from CDN --> <script type="module" src="https://js.arcgis.com/5.1/"></script>
<!-- ARCADE SCRIPTS -->
<!-- PREDOMINANT POLITICAL PARTY -->
<script type="text/plain" id="predominance">
// store field values in variables with // meaningful names. Each is the total count // of people that attained each education level
var noHighSchool = $feature.NOHS_CY; var someHighSchool = $feature.SOMEHS_CY; var highSchool = $feature.HSGRAD_CY; var ged = $feature.GED_CY; var someCollege = $feature.SMCOLL_CY; var associates = $feature.ASSCDEG_CY; var bachelors = $feature.BACHDEG_CY; var grad = $feature.GRADDEG_CY;
var all = [ noHighSchool, someHighSchool, highSchool, ged, someCollege, associates, bachelors, grad, ];
// Match the maximum value with the label // of the respective field and return it for // use in a UniqueValueRenderer
return Decode( Max(all), noHighSchool, 'No high school', someHighSchool, 'Some high school', highSchool, 'High school diploma', ged, 'GED', someCollege, 'Some college', associates, 'Associate\'s degree', bachelors, 'Bachelor\'s degree', grad, 'Master\'s degree or higher', 'n/a' );
</script>
<script type="module"> const [WebMap, MapView, FeatureLayer, Legend, Expand] = await $arcgis.import([ "@arcgis/core/WebMap.js", "@arcgis/core/views/MapView.js", "@arcgis/core/layers/FeatureLayer.js", "@arcgis/core/widgets/Legend.js", "@arcgis/core/widgets/Expand.js", ]);
function createSymbol(color) { return { type: "simple-fill", color: color, outline: { width: 0.3, color: [255, 255, 255, 0.2], }, }; }
const colors = ["#00b6f1", "#d9bf0d", "#6a28c7", "#c44245", "#b9a087", "#ab579d", "#78aea0", "#1e8553"]; const predominanceArcade = document.getElementById("predominance").text; const renderer = { type: "unique-value", valueExpression: predominanceArcade, valueExpressionTitle: "Predominant educational attainment", uniqueValueInfos: [ { value: "Master's degree or higher", symbol: createSymbol(colors[0]), }, { value: "Bachelor's degree", symbol: createSymbol(colors[1]), }, { value: "Associate's degree", symbol: createSymbol(colors[2]), }, { value: "Some college", symbol: createSymbol(colors[3]), }, { value: "GED", symbol: createSymbol(colors[4]), }, { value: "High school diploma", symbol: createSymbol(colors[5]), }, { value: "Some high school", symbol: createSymbol(colors[6]), }, { value: "No high school", symbol: createSymbol(colors[7]), }, ], };53 collapsed lines
const layer = new FeatureLayer({ portalItem: { id: "1cbb0faa0f1f424bbe213bfae9319309", }, renderer: renderer, blendMode: "multiply", });
const map = new WebMap({ portalItem: { id: "9cf503b654144873a8e33f996f91ba1d", }, layers: [layer], });
const view = new MapView({ container: "viewDiv", map: map, scale: 577790, center: [-117.8099, 34.0441], constraints: { snapToZoom: false, }, });
view.ui.add( new Expand({ content: new Legend({ view: view, }), view: view, expanded: false, }), "top-right", ); </script>
<style> html, body, #viewDiv { height: 100%; margin: 0; } </style> </head>
<body> <div id="viewDiv"></div> </body></html>Predominance with opacity
In a predominance visualization, the color representing the predominant value will shade the whole polygon with the same opacity and saturation as any neighboring polygon even if the predominant value wins over other values by the slimmest margin.
Adding an opacity variable helps emphasize strong predominant values and wash out features where the predominant value is relatively weak. The Arcade expression can return the margin between the predominant value and the second place value, or it can be simpler and return the share of the predominant value as a percentage of all values.
116 collapsed lines
<!doctype html><html> <head> <meta charset="utf-8" /> <meta name="viewport" content="width=device-width, initial-scale=1, shrink-to-fit=no" /> <title>Esri Developer Guide: Predominance with opacity</title>
<link rel="stylesheet" href="https://js.arcgis.com/5.1/esri/themes/light/main.css" /> <!-- Load the ArcGIS Maps SDK for JavaScript from CDN --> <script type="module" src="https://js.arcgis.com/5.1/"></script>
<!-- ARCADE SCRIPTS -->
<script type="text/plain" id="predominance">
// store field values in variables with // meaningful names. Each is the total count // of people that attained each education level
var noHighSchool = $feature.NOHS_CY; var someHighSchool = $feature.SOMEHS_CY; var highSchool = $feature.HSGRAD_CY; var ged = $feature.GED_CY; var someCollege = $feature.SMCOLL_CY; var associates = $feature.ASSCDEG_CY; var bachelors = $feature.BACHDEG_CY; var grad = $feature.GRADDEG_CY;
var all = [ noHighSchool, someHighSchool, highSchool, ged, someCollege, associates, bachelors, grad, ];
// Match the maximum value with the label // of the respective field and return it for // use in a UniqueValueRenderer
return Decode( Max(all), noHighSchool, 'No high school', someHighSchool, 'Some high school', highSchool, 'High school diploma', ged, 'GED', someCollege, 'Some college', associates, 'Associate\'s degree', bachelors, 'Bachelor\'s degree', grad, 'Master\'s degree or higher', 'n/a' );
</script>
<script type="module"> const [WebMap, MapView, FeatureLayer, Legend, Expand] = await $arcgis.import([ "@arcgis/core/WebMap.js", "@arcgis/core/views/MapView.js", "@arcgis/core/layers/FeatureLayer.js", "@arcgis/core/widgets/Legend.js", "@arcgis/core/widgets/Expand.js", ]);
function createSymbol(color) { return { type: "simple-fill", color: color, outline: { width: 0.3, color: [255, 255, 255, 0.2], }, }; }
const colors = ["#00b6f1", "#d9bf0d", "#6a28c7", "#c44245", "#b9a087", "#ab579d", "#78aea0", "#1e8553"]; const predominanceArcade = document.getElementById("predominance").text; const renderer = { type: "unique-value", valueExpression: predominanceArcade, valueExpressionTitle: "Predominant educational attainment", uniqueValueInfos: [ { value: "Master's degree or higher", symbol: createSymbol(colors[0]), }, { value: "Bachelor's degree", symbol: createSymbol(colors[1]), }, { value: "Associate's degree", symbol: createSymbol(colors[2]), }, { value: "Some college", symbol: createSymbol(colors[3]), }, { value: "GED", symbol: createSymbol(colors[4]), }, { value: "High school diploma", symbol: createSymbol(colors[5]), }, { value: "Some high school", symbol: createSymbol(colors[6]), }, { value: "No high school", symbol: createSymbol(colors[7]), }, ], };
renderer.visualVariables = [ { type: "opacity", valueExpression: ` var all = [ $feature.NOHS_CY, $feature.SOMEHS_CY, $feature.HSGRAD_CY, $feature.GED_CY, $feature.SMCOLL_CY, $feature.ASSCDEG_CY, $feature.BACHDEG_CY, $feature.GRADDEG_CY ]; var predominantValue = Max(all); var total = Sum(all);
return (predominantValue / total) * 100; `, valueExpressionTitle: "% of people comprising the dominant educational attainment group", stops: [ { value: 22, opacity: 0.05, label: "< 22%" }, { value: 40, opacity: 1.0, label: "> 40%" }, ], }, ];53 collapsed lines
const layer = new FeatureLayer({ portalItem: { id: "1cbb0faa0f1f424bbe213bfae9319309", }, renderer: renderer, blendMode: "multiply", });
const map = new WebMap({ portalItem: { id: "9cf503b654144873a8e33f996f91ba1d", }, layers: [layer], });
const view = new MapView({ container: "viewDiv", map: map, scale: 577790, center: [-117.8099, 34.0441], constraints: { snapToZoom: false, }, });
view.ui.add( new Expand({ content: new Legend({ view: view, }), view: view, expanded: false, }), "top-right", ); </script>
<style> html, body, #viewDiv { height: 100%; margin: 0; } </style> </head>
<body> <div id="viewDiv"></div> </body></html>Predominance with size
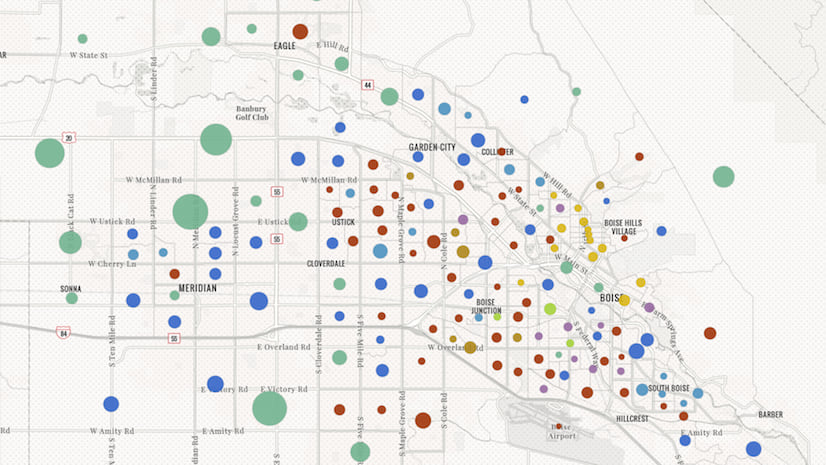
Many times in demographic maps, large features represent areas with fewer people. In a predominance visualization, the colors of these large features can dominate the view, thus making them appear more influential or important than they actually are.
Adding a size variable that returns the sum of all categories considered in the predominance expression can help provide additional context to the user. This requires switching from a fill symbol to a marker symbol.
This is particularly important for election maps where relatively unimportant large areas dominate the view more than high population areas.
116 collapsed lines
<!doctype html><html> <head> <meta charset="utf-8" /> <meta name="viewport" content="width=device-width, initial-scale=1, shrink-to-fit=no" /> <title>Esri Developer Guide: Predominance with size</title>
<link rel="stylesheet" href="https://js.arcgis.com/5.1/esri/themes/light/main.css" /> <!-- Load the ArcGIS Maps SDK for JavaScript from CDN --> <script type="module" src="https://js.arcgis.com/5.1/"></script>
<!-- ARCADE SCRIPTS -->
<script type="text/plain" id="predominance">
// store field values in variables with // meaningful names. Each is the total count // of people that attained each education level
var noHighSchool = $feature.NOHS_CY; var someHighSchool = $feature.SOMEHS_CY; var highSchool = $feature.HSGRAD_CY; var ged = $feature.GED_CY; var someCollege = $feature.SMCOLL_CY; var associates = $feature.ASSCDEG_CY; var bachelors = $feature.BACHDEG_CY; var grad = $feature.GRADDEG_CY;
var all = [ noHighSchool, someHighSchool, highSchool, ged, someCollege, associates, bachelors, grad, ];
// Match the maximum value with the label // of the respective field and return it for // use in a UniqueValueRenderer
return Decode( Max(all), noHighSchool, 'No high school', someHighSchool, 'Some high school', highSchool, 'High school diploma', ged, 'GED', someCollege, 'Some college', associates, 'Associate\'s degree', bachelors, 'Bachelor\'s degree', grad, 'Master\'s degree or higher', 'n/a' );
</script>
<script type="module"> const [WebMap, MapView, FeatureLayer, Legend, Expand] = await $arcgis.import([ "@arcgis/core/WebMap.js", "@arcgis/core/views/MapView.js", "@arcgis/core/layers/FeatureLayer.js", "@arcgis/core/widgets/Legend.js", "@arcgis/core/widgets/Expand.js", ]);
function createSymbol(color) { return { type: "simple-marker", color: color, outline: { width: 0.3, color: [0, 0, 0, 0.2], }, }; }
const colors = ["#00b6f1", "#d9bf0d", "#6a28c7", "#c44245", "#b9a087", "#ab579d", "#78aea0", "#1e8553"]; const predominanceArcade = document.getElementById("predominance").text; const renderer = { type: "unique-value", valueExpression: predominanceArcade, valueExpressionTitle: "Predominant educational attainment", uniqueValueInfos: [ { value: "Master's degree or higher", symbol: createSymbol(colors[0]), }, { value: "Bachelor's degree", symbol: createSymbol(colors[1]), }, { value: "Associate's degree", symbol: createSymbol(colors[2]), }, { value: "Some college", symbol: createSymbol(colors[3]), }, { value: "GED", symbol: createSymbol(colors[4]), }, { value: "High school diploma", symbol: createSymbol(colors[5]), }, { value: "Some high school", symbol: createSymbol(colors[6]), }, { value: "No high school", symbol: createSymbol(colors[7]), }, ], };
renderer.visualVariables = [ { type: "size", valueExpression: ` var all = [ $feature.NOHS_CY, $feature.SOMEHS_CY, $feature.HSGRAD_CY, $feature.GED_CY, $feature.SMCOLL_CY, $feature.ASSCDEG_CY, $feature.BACHDEG_CY, $feature.GRADDEG_CY ]; var total = Sum(all); return total; `, valueExpressionTitle: "Population 25+", minSize: "2px", maxSize: "48px", minDataValue: 1000, maxDataValue: 15000, }, ];53 collapsed lines
const layer = new FeatureLayer({ portalItem: { id: "1cbb0faa0f1f424bbe213bfae9319309", }, renderer: renderer, blendMode: "multiply", });
const map = new WebMap({ portalItem: { id: "9cf503b654144873a8e33f996f91ba1d", }, layers: [layer], });
const view = new MapView({ container: "viewDiv", map: map, scale: 288895, center: [-117.8099, 34.0441], constraints: { snapToZoom: false, }, });
view.ui.add( new Expand({ content: new Legend({ view: view, }), view: view, expanded: false, }), "top-right", ); </script>
<style> html, body, #viewDiv { height: 100%; margin: 0; } </style> </head>
<body> <div id="viewDiv"></div> </body></html>Related samples and resources
Generate a predominance visualization
Create a custom visualization using Arcade
Smart Mapping with Arcade: Visualizing predominance
Creating a predominance visualization with Arcade
API support
| 2D | 3D | Arcade | Points | Lines | Polygons | Mesh | |
|---|---|---|---|---|---|---|---|
| | | | | | | | |
| | | | | | | | |
| | | | | | | ||
| | | | | | | | |
| | | | | | | | |
| | | | | | | | |
| | | | | | | | |
| | | | | | | | |
| | | | | | | | |
| | | |
- Color only
- Size variable creators only supported for points
- Size variable creators not supported in 3D