This sample demonstrates how to visualize features based on numeric data using manually defined class breaks. When breaks are known or predefined, this renderer provides options for setting a distinguishing symbol for each class break.
Prior to completing the following steps, you should be familiar with the Map component and FeatureLayer. The basic components of this app, such as creating instances of the Map component, and understanding HTML and CSS structure will not be reviewed in this sample.
Create a symbol for each class break
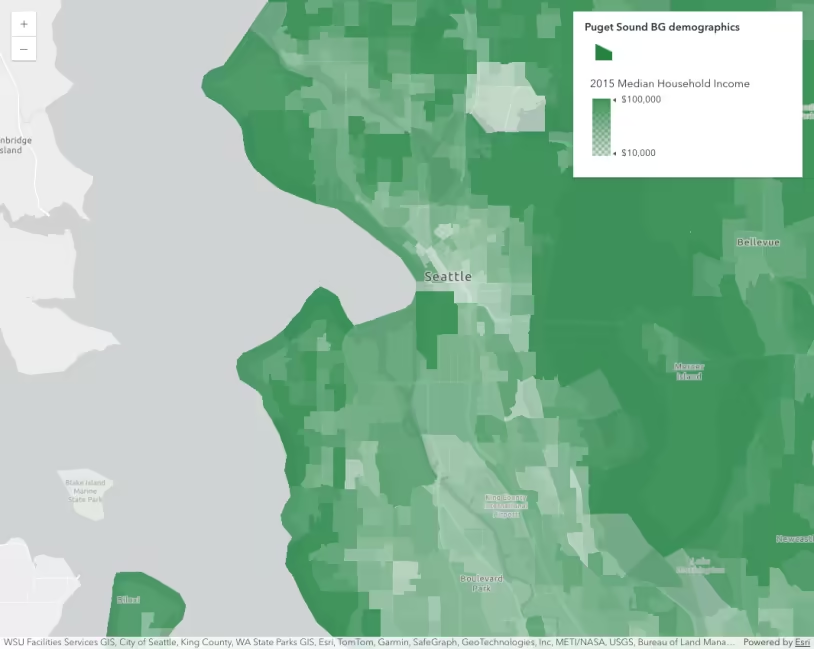
This application uses data representing U.S. Census block groups in Seattle, WA. The demographic of interest is the number of adults ages 25+ who have a college degree. Our users may have predefined breaks they want to use for visualizing this data, such as areas were 0 - 35% of the population has a degree, 35% - 50%, 50% - 75%, and 75% - 100%.
First, we’ll define a separate symbol for each break using SimpleFillSymbol.
const less35 = { type: "simple-fill", // autocasts as new SimpleFillSymbol() color: "#fffcd4", style: "solid", outline: { width: 0.2, color: [255, 255, 255, 0.5], }, }; const less50 = { type: "simple-fill", // autocasts as new SimpleFillSymbol() color: "#b1cdc2", style: "solid", outline: { width: 0.2, color: [255, 255, 255, 0.5], }, }; const more50 = { type: "simple-fill", // autocasts as new SimpleFillSymbol() color: "#38627a", style: "solid", outline: { width: 0.2, color: [255, 255, 255, 0.5], }, }; const more75 = { type: "simple-fill", // autocasts as new SimpleFillSymbol() color: "#0d2644", style: "solid", outline: { width: 0.2, color: [255, 255, 255, 0.5], }, };Create an instance of ClassBreaksRenderer
We can use a ClassBreaksRenderer when defining class breaks for features. In the constructor we specify the field and normalizationField, which contains the data of interest.
const renderer = { type: "class-breaks", // autocasts as new ClassBreaksRenderer() field: "COL_DEG", // total number of adults (25+) with a college degree normalizationField: "EDUCBASECY", // total number of adults 25+ legendOptions: { title: "% of adults (25+) with a college degree", }, defaultSymbol: { type: "simple-fill", // autocasts as new SimpleFillSymbol() color: "black", style: "backward-diagonal", outline: { width: 0.5, color: [50, 50, 50, 0.6], }, }, defaultLabel: "no data",
};Set symbol on each class break
You can set a symbol on each class break in one of two ways: Using classBreakInfos in the constructor…
classBreakInfos: [ { minValue: 0, maxValue: 0.3499, symbol: less35, label: "< 35%", // label for symbol in legend }, { minValue: 0.35, maxValue: 0.4999, symbol: less50, label: "35 - 50%", // label for symbol in legend }, { minValue: 0.5, maxValue: 0.7499, symbol: more50, label: "50 - 75%", // label for symbol in legend }, { minValue: 0.75, maxValue: 1.0, symbol: more75, label: "> 75%", // label for symbol in legend }, ],Or with the addClassBreakInfo() method.
renderer.addClassBreakInfo(0, 0.3499, less35);Once the renderer is defined, you can set it on the layer and the view and legend will automatically update.
Additional visualization samples
Data-driven continuous color
Data-driven continuous size
Data-driven extrusion
Data-driven opacity
Thematic multivariate visualization (2D)