This sample uses the recorded locations of hurricanes to demonstrate how to visualize multiple data attributes in a single renderer using 3D symbols in a 3D scene. In this case a PointSymbol3D is used in conjunction with a cone primitive in an ObjectSymbol3DLayer to symbolize wind speed and pressure.
color is used to visualize atmospheric pressure and the height of each cone indicates the wind speed in knots.
const renderer = { type: "simple", // autocasts as new SimpleRenderer() symbol: { // symbol type required for rendering point geometries type: "point-3d", // autocasts as new PointSymbol3D() symbolLayers: [ { // renders points as volumetric objects type: "object", // autocasts as new ObjectSymbol3DLayer() resource: { primitive: "cone" }, // renders points as cones width: 50000, }, ], }, visualVariables: [ { type: "color", field: "PRESSURE", // field containing data for atmospheric pressure stops: [ { value: 950, color: "red" }, { value: 1020, color: "blue" }, ], }, { type: "size", field: "WINDSPEED", // field containing data for wind speed stops: [ { value: 20, size: 60000 }, { value: 150, size: 500000 }, ], axis: "height", }, { type: "size", axis: "width-and-depth", useSymbolValue: true, // uses the width value defined in the symbol layer (50,000) }, ],};The axis property of the size visual variables indicates how to define the size of each feature. the width-and-depth size variable is used to set a constant diameter to the base of each cone. The height size variable, on the other hand, uses the values of the WINDSPEED field to determine a size between 60 and 500 kilometers in height.
Related samples and resources
Data-driven extrusion
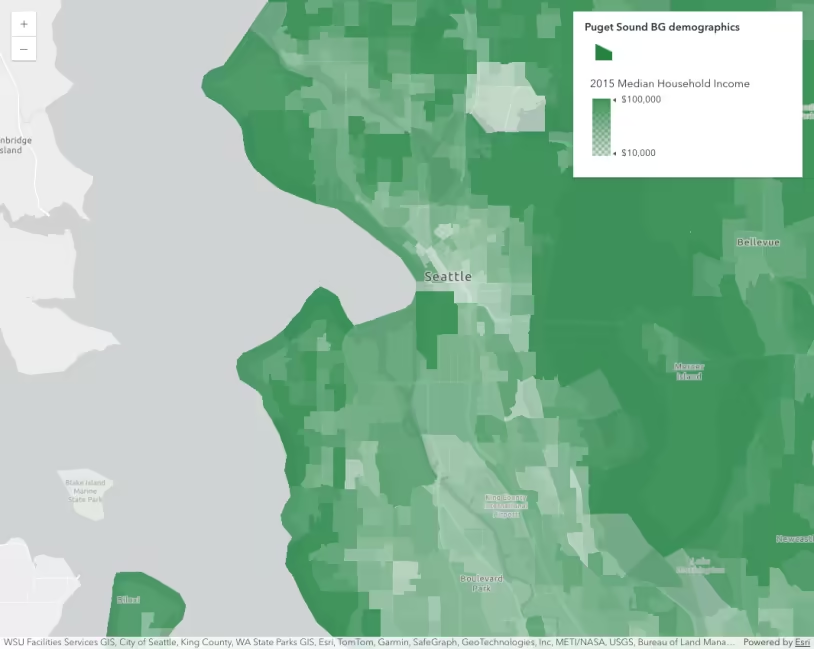
Data-driven opacity
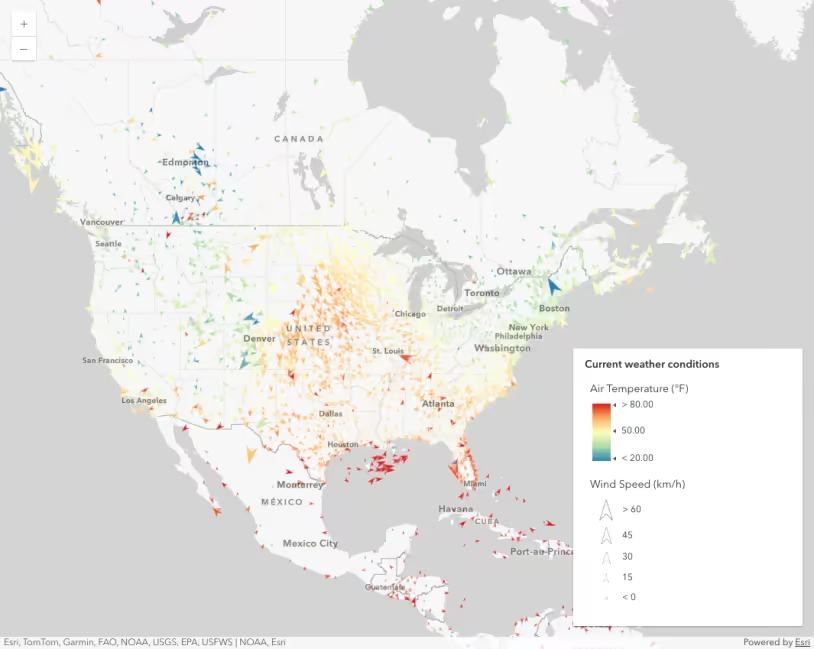
Thematic multivariate visualization (2D)
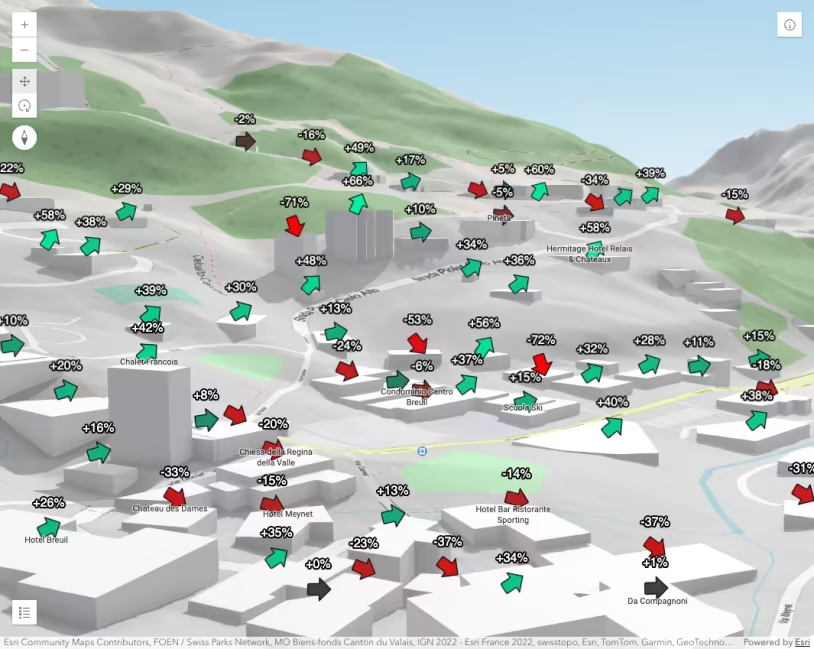
3D icon rotation
Data-driven continuous color
Data-driven continuous size
