This sample demonstrates how clustering can be used to group features into clusters based on their spatial proximity to one another. Clustering is enabled on the layer’s featureReduction property.
Since featureReduction is independent of the renderer, the symbol and popupTemplate of each cluster graphic can be used to summarize features within the cluster. See Clustering styles and configurations for more information about the various ways clusters can summarize the features they represent.
The layer’s renderer in this sample visualizes weather data with three visual variables, each representing a different attribute:
- Color:
TEMP - Size:
WIND_SPEED - Rotation:
WIND_DIRECT
The renderer object looks like the following:
const renderer = { type: "simple", // autocasts as new SimpleRenderer() symbol: { type: "simple-marker", // autocasts as new SimpleMarkerSymbol() // Arrow marker path: "M14.5,29 23.5,0 14.5,9 5.5,0z", color: [50, 50, 50], outline: { color: [0, 0, 0, 0.7], width: 0.5, }, angle: 180, size: 15, }, visualVariables: [ { type: "rotation", // Use {cluster_avg_WIND_DIRECT} in the // featureReudction.popupTemplate to // display the average temperature of all // features within the cluster field: "WIND_DIRECT", rotationType: "geographic", }, { type: "size", // Use {cluster_avg_WIND_SPEED} in the // featureReudction.popupTemplate to // display the average temperature of all // features within the cluster field: "WIND_SPEED", minDataValue: 0, maxDataValue: 60, minSize: 8, maxSize: 40, }, { type: "color", // Use {cluster_avg_TEMP} in the // featureReudction.popupTemplate to // display the average temperature of all // features within the cluster field: "TEMP", stops: [ { value: 20, color: "#2b83ba" }, { value: 35, color: "#abdda4" }, { value: 50, color: "#ffffbf" }, { value: 65, color: "#fdae61" }, { value: 80, color: "#d7191c" }, ], }, ], };To enable clustering on the layer, you simply have to set the featureReduction property to type cluster,
layer.featureReduction = { type: "cluster",};This will cluster the features using the default clusterRadius (80px), and assign a symbol to each cluster conforming to the visualVariables in the renderer in the following manner:
- Color: average
TEMPof all features in the cluster - Size: average
WIND_SPEEDof all features in the cluster - Rotation: average
WIND_DIRECTof all features in the cluster
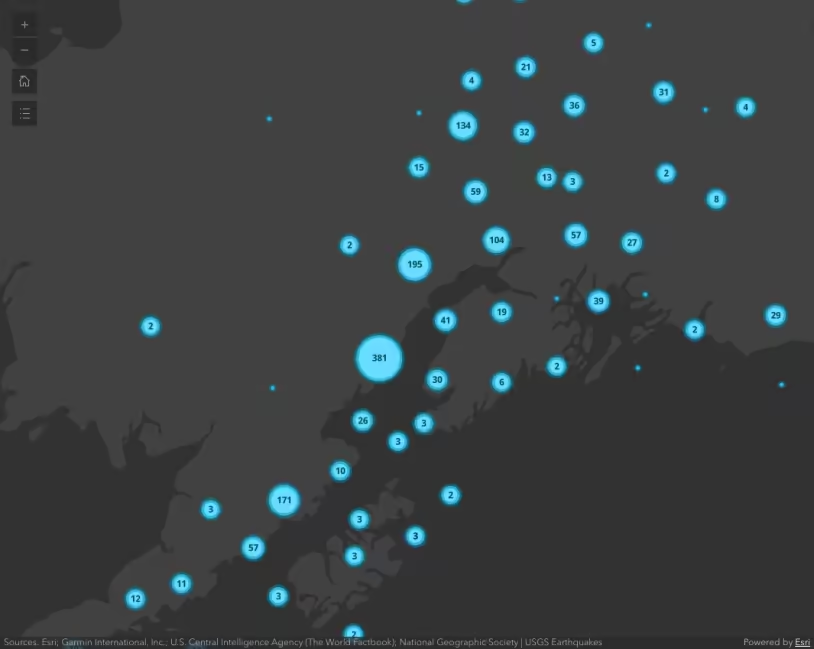
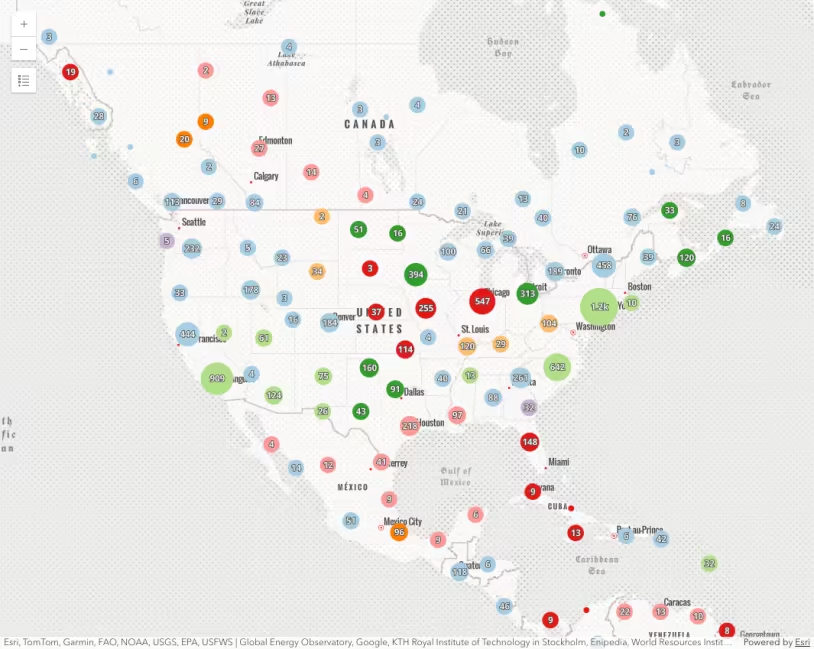
| No feature reduction | Clustered features |
|---|---|
 |  ) ) |
If a UniqueValueRenderer were used, the symbol of the predominant uniqueValueInfo among the features in the cluster would be used to represent the cluster.
To provide more meaning to the app, you can configure a popupTemplate to display the average values of all the fields used by the renderer when the user clicks or taps the cluster.
const clusterConfig = { type: "cluster", popupTemplate: { content: [ { type: "text", text: "This cluster represents <b>{cluster_count}</b> weather stations.", }, { type: "fields", fieldInfos: [ { fieldName: "cluster_avg_WIND_SPEED", label: "Average wind speed (km/h)", format: { places: 0, }, }, { fieldName: "cluster_avg_WIND_DIRECT", label: "Average wind direction (degrees)", format: { places: 0, }, }, { fieldName: "cluster_avg_TEMP", label: "Average temperature (°F)", format: { places: 0, }, }, ], }, ], }, };
Related samples and resources
Intro to clustering
Clustering - generate suggested configuration
Clustering - query clusters
Clustering - advanced configuration
Popup charts for clusters