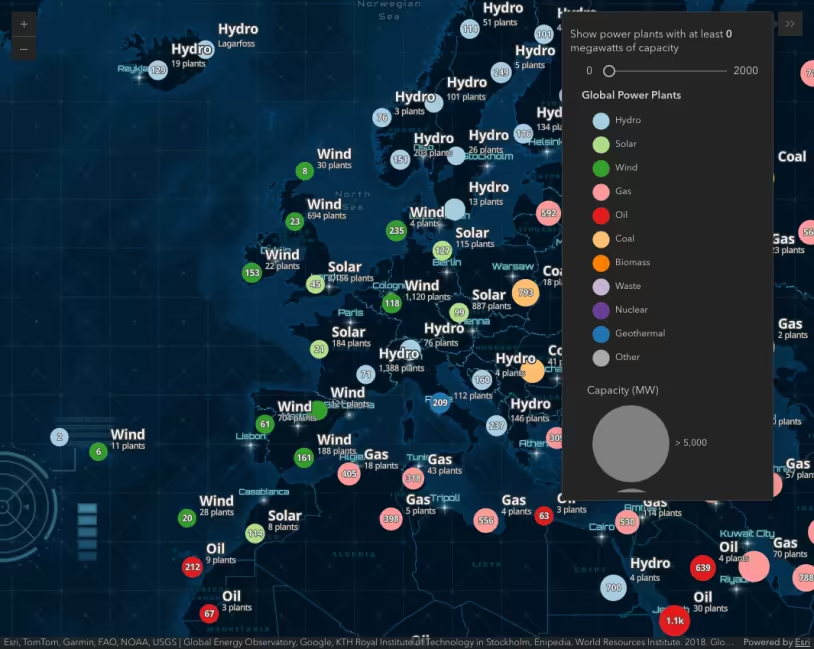
This sample demonstrates how to query and filter features represented by clusters using Arcade expressions in a cluster’s popup.
Typically clusters display basic summary information about all features in the cluster, such as the total number of features, the predominant type, or the average value of a numeric field. Sometimes you may want to display information about a subset of important features, such as the number of fatalities in a cluster representing car crashes.
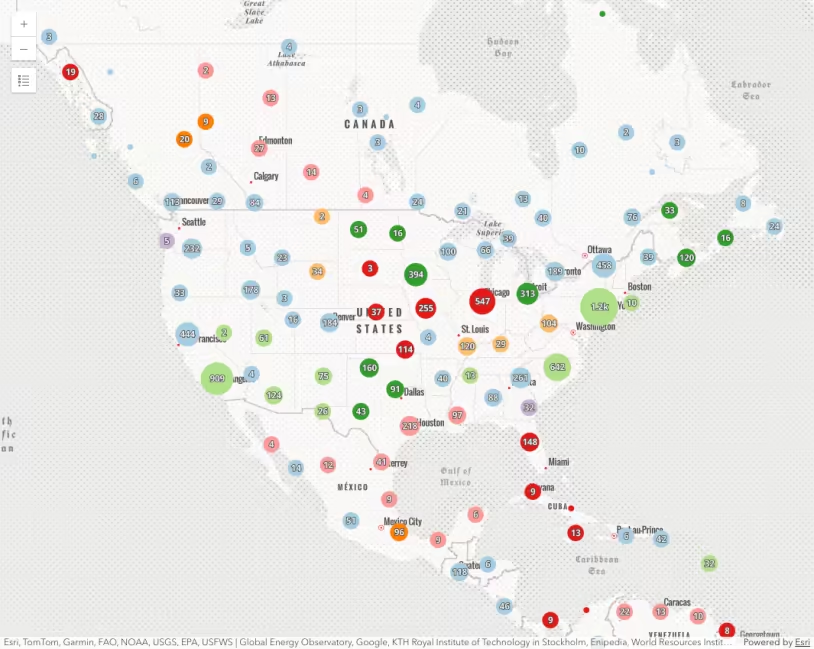
The cluster popup in this example displays the total number of power plants that generate power with coal, along with the amount of power they produce as a ratio to all power produced in the cluster. This is all accomplished with Arcade expressions. Within the context of a cluster popup, you can use Arcade to filter a cluster’s features and perform statistics on those features.
Use Arcade to summarize clusters
Arcade expressions in cluster popups give you access to the cluster graphic itself (i.e. $feature) and the features that make up the cluster (i.e. $aggregatedFeatures).
$feature
The $feature profile variable allows you to reference aggregate fields used by the renderer, such as $feature.cluster_count. If the renderer visualizes population with a numeric POP field, you will have access to the average population of features in the cluster by referencing $feature.cluster_avg_POP within the expression.
$aggregatedFeatures
The $aggregatedFeatures profile variable represents all features included in the cluster. You can use this profile variable to iterate through features, filter them, and calculate statistics with the features.
// returns the total number of features in the cluster// this will be the same as $feature.cluster_countCount($aggregatedFeatures)// returns the count of features of fuel type 'Coal' within the clusterCount(Filter($aggregatedFeatures, "fuel1 = 'Coal'"))The Expects Arcade function tells the clustered layer to request extra
fields required for the popup to function properly.
// returns the amount of power generated by coal power plants// as a percentage of total power produced in the cluster along// with the total number of coal power plants
// Since the capacity_mw field may not be available on the client// at runtime, we tell the Arcade engine to request it from the layerExpects($aggregatedFeatures, "capacity_mw")var mWtotal = Sum($aggregatedFeatures, "capacity_mw");var mWCoal = Sum(Filter($aggregatedFeatures, "fuel1 = 'Coal'"), "capacity_mw");if(mWCoal < 1){  return "none";}var mWratio = Round(mWCoal / mWtotal, 4);return \`\${Text(mWratio, "#.#%")} (\${Text(mWCoal, "#,### mW")})\`;
// the output will look like "15% (6,500 mW)"
To use values returned from Arcade expressions within a popup, you must set the
Arcade expressions in the expressionInfos property of the popupTemplate, then reference it using
the {expression/expression-name} syntax.
let popupTemplate = { title: "Coal summary", content: `<p>This cluster represents <b>{cluster_count}</b> power plants. <b>{expression/Coal-count}</b> of these plants are fueled by Coal.</p><p>Coal plants produce <b>{expression/Coal-mw-sum}</b> of the total power generated in this cluster.</p>`, expressionInfos: [ { name: "Coal-count", title: "Coal-count", expression: ` // returns the total number of coal power plants Count(Filter($aggregatedFeatures, "fuel1 = 'Coal'")) `, }, { name: "Coal-mw-sum", title: "Coal-mw-sum", expression: ` // returns the amount of electricity generated by coal // in this cluster as a ratio to the total capacity // of plants included in the cluster Expects($aggregatedFeatures, "capacity_mw") var mWtotal = Sum($aggregatedFeatures, "capacity_mw"); var mWCoal = Sum(Filter($aggregatedFeatures, "fuel1 = 'Coal'"), "capacity_mw"); if(mWCoal < 1){ return "none"; } var mWratio = Round(mWCoal / mWtotal, 4); return \`\${Text(mWratio, "#.#%")} (\${Text(mWCoal, "#,### mW")})\`; `, }, ], };Related samples and resources
Intro to clustering
Clustering - generate suggested configuration
Clustering - query clusters
Clustering - advanced configuration
Popup charts for clusters