Roads and highways in Singapore. Zoom in and out to view how features are thinned based on highway classification. Only larger, more traveled highways display at small scales. This reduces the initial download size and declutters the visualization.
What is thinning?
Thinning is a method of decluttering the view by removing features that overlap one another. This is helpful when many features overlap and you want to display uncluttered data, but don’t necessarily need to communicate its density.
How thinning works
There are a couple of approaches to thinning:
- Feature reduction by selection only applies to point layers in 3D scenes and is configured on the
featureReductionproperty of the layer. When set, overlapping features are randomly removed from the view and displayed at scales and camera angles where they no longer overlap nearby features. - Display filters control which features are displayed in the view based on the view scale. This is useful for reducing the download size of large layers and improving the visualization, particularly for mobile devices.
Examples
Feature reduction by selection (3D)
The following example demonstrates how to declutter the view by randomly removing overlapping features. This is controlled using the FeatureReductionSelection option on point layers in 3D scenes. Simply set the featureReduction type on the layer to selection and features will be thinned automatically.
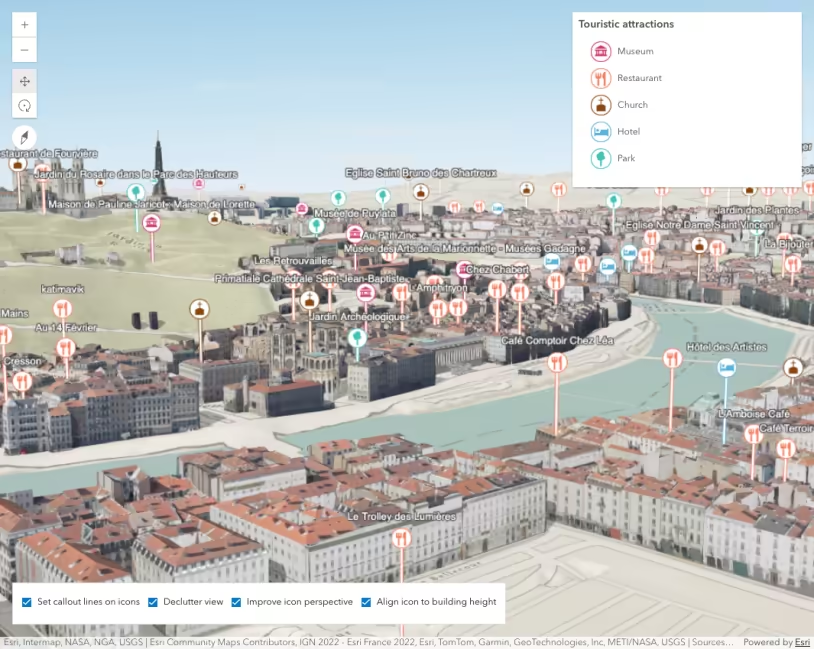
Points of interest in Lyon, France. Thinning helps declutter the view to make it easier for users to navigate a scene. Uncheck the box in the top right corner to compare the cluttered view with the decluttered view. Zoom in and out to see how feature reduction selection affects the visualization.
171 collapsed lines
<html> <head> <meta charset="utf-8" /> <title>Point styles for cities</title> <link rel="stylesheet" href="https://js.arcgis.com/5.1/esri/themes/light/main.css" /> <!-- Load the ArcGIS Maps SDK for JavaScript from CDN --> <script type="module" src="https://js.arcgis.com/5.1/"></script>
<style> html, body, #viewDiv { height: 100%; margin: 0; }
#cityStyle { background-color: white; text-align: center; padding: 10px; font-size: 0.9em; }
#cityStyle label { padding-right: 10px; cursor: pointer; } </style>
<script type="module"> const [WebScene, FeatureLayer, SceneView, Legend] = await $arcgis.import([ "@arcgis/core/WebScene.js", "@arcgis/core/layers/FeatureLayer.js", "@arcgis/core/views/SceneView.js", "@arcgis/core/widgets/Legend.js", ]);
// Load the webscene with buildings
const webscene = new WebScene({ portalItem: { // autocasts as new PortalItem() id: "711ddecedece4fd88b728bfe4322c22b", }, });
const view = new SceneView({ container: "viewDiv", map: webscene, environment: { lighting: { directShadowsEnabled: true, }, }, });
// verticalOffset shifts the symbol vertically const verticalOffset = { screenLength: 40, maxWorldLength: 200, minWorldLength: 35, };
// Function that automatically creates the symbol for the points of interest function getUniqueValueSymbol(name, color) { return { type: "point-3d", symbolLayers: [ { type: "icon", resource: { href: name, }, size: 20, outline: { color: "white", size: 2, }, }, ],
verticalOffset: verticalOffset,
callout: { type: "line", color: "white", size: 2, border: { color: color, }, }, }; }
const pointsRenderer = { type: "unique-value", field: "Type", uniqueValueInfos: [ { value: "Museum", symbol: getUniqueValueSymbol( "https://developers.arcgis.com/javascript/latest/assets/sample-code/visualization-point-styles/Museum.avif", "#D13470", ), }, { value: "Restaurant", symbol: getUniqueValueSymbol( "https://developers.arcgis.com/javascript/latest/assets/sample-code/visualization-point-styles/Restaurant.avif", "#F97C5A", ), }, { value: "Church", symbol: getUniqueValueSymbol( "https://developers.arcgis.com/javascript/latest/assets/sample-code/visualization-point-styles/Church.avif", "#884614", ), }, { value: "Hotel", symbol: getUniqueValueSymbol( "https://developers.arcgis.com/javascript/latest/assets/sample-code/visualization-point-styles/Hotel.avif", "#56B2D6", ), }, { value: "Park", symbol: getUniqueValueSymbol( "https://developers.arcgis.com/javascript/latest/assets/sample-code/visualization-point-styles/Park.avif", "#40C2B4", ), }, ], };
const pointsLayer = new FeatureLayer({ url: "http://services.arcgis.com/V6ZHFr6zdgNZuVG0/arcgis/rest/services/LyonPointsOfInterest/FeatureServer", title: "Touristic attractions", elevationInfo: { mode: "relative-to-scene", }, renderer: pointsRenderer, outFields: ["*"], screenSizePerspectiveEnabled: true, labelingInfo: [ { labelExpressionInfo: { value: "{Name}", }, symbol: { type: "label-3d", symbolLayers: [ { type: "text", material: { color: "white", }, halo: { size: 1, color: [50, 50, 50], }, size: 10, }, ], }, }, ], });
pointsLayer.featureReduction = { type: "selection", };26 collapsed lines
webscene.add(pointsLayer);
// add functionality on the controls for selection, perspective, callout lines and relative-to-scene elevation mode document.getElementById("cityStyle").addEventListener("change", (event) => { if (event.target.id === "declutter") { const type = { type: "selection", }; pointsLayer.featureReduction = event.target.checked ? type : null; } });
view.ui.add(document.getElementById("cityStyle"), "top-right"); </script> </head>
<body> <div id="viewDiv" class="esri-widget"></div> <div id="cityStyle"> <input type="checkbox" id="declutter" name="mode" checked="" /> <label for="declutter">Declutter view</label> </div> </body></html>Display filter
This example demonstrates how to set a display filter on a layer to control which features are visible based on the view scale. This is useful for reducing the download size of large layers, particularly for mobile devices.
Roads and highways in Singapore. Zoom in and out to view how features are thinned based on highway classification. Only larger, more traveled highways display at small scales. This reduces the initial download size and declutters the visualization.
For example, the OpenStreetMap Asia highways layer contains more than 46 million high resolution line features with more than 20 attributes. Since this layer requires several gigabytes of memory to draw all features, it isn’t feasible to load the entire dataset to a browser.
Thinning this data with a display filter can significantly improve the initial download size and the visualization.
| Thinning | No thinning | |
|---|---|---|
| Initial download size | 141kB (27.8kB compressed) | 12.2MB (2.1MB compressed) |
| Preview | 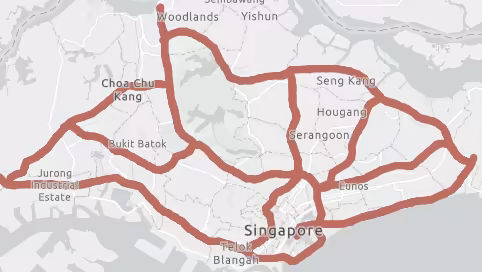 | 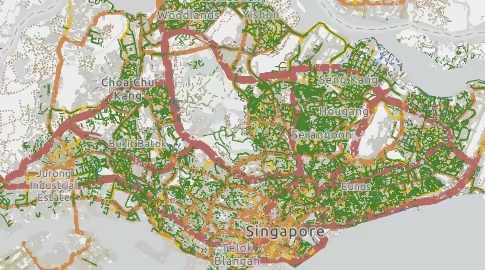 |
First, you should set scale visibility constraints to restrict the entire layer visibility at scales best suited given the density of the data. This is controlled by the minScale and maxScale properties of the layer.
19 collapsed lines
<html> <head> <meta charset="utf-8" /> <meta name="viewport" content="width=device-width, initial-scale=1, shrink-to-fit=no" /> <title>Highways in Singapore</title>
<link rel="stylesheet" href="https://js.arcgis.com/5.1/esri/themes/light/main.css" /> <!-- Load the ArcGIS Maps SDK for JavaScript from CDN --> <script type="module" src="https://js.arcgis.com/5.1/"></script>
<script type="module"> const [MapView, WebMap, FeatureLayer, reactiveUtils] = await $arcgis.import([ "@arcgis/core/views/MapView.js", "@arcgis/core/WebMap.js", "@arcgis/core/layers/FeatureLayer.js", "@arcgis/core/core/reactiveUtils.js", ]);
const highwaysLayer = new FeatureLayer({ portalItem: { id: "a9f8d83a69fc4f2c92e5f83f87df6aaf", }, minScale: 1000000, maxScale: 0, });85 collapsed lines
highwaysLayer.displayFilterInfo = { mode: "scale", filters: [ { title: "Large highways", minScale: Infinity, maxScale: 150000, where: "highway IN ('motorway')", }, { title: "Small highways", minScale: 150000, maxScale: 60000, where: "highway IN ('motorway', 'trunk', 'trunk_link')", }, { title: "Major roads", minScale: 60000, maxScale: 45000, where: "highway IN ('motorway', 'motorway_link', 'trunk', 'trunk_link', 'primary', 'primary_link')", }, { title: "Roads", minScale: 45000, maxScale: 30000, where: "highway IN ('motorway', 'motorway_link', 'trunk', 'trunk_link', 'primary', 'primary_link')", }, { title: "Smallest roads", minScale: 30000, maxScale: 10000, where: "highway IN ('motorway', 'motorway_link', 'trunk', 'trunk_link', 'primary', 'primary_link', 'secondary', 'secondary_link')", }, { title: "all", minScale: 10000, maxScale: 0, }, ], };
const view = new MapView({ container: "viewDiv", map: new WebMap({ basemap: "gray-vector", layers: [highwaysLayer], }), constraints: { snapToZoom: false, }, viewpoint: { rotation: 0, scale: 175000, targetGeometry: { type: "point", spatialReference: { latestWkid: 3857, wkid: 102100, }, x: 11557036.825180829, y: 147507.71438237422, }, }, }); </script>
<style> html, body, #viewDiv { height: 100%; margin: 0; } </style> </head>
<body> <div id="viewDiv"></div> </body></html>While this will prevent users from loading unreasonable amounts of data to the browser, it still may not be aggressive enough, especially for mobile devices. You can further reduce download size by filtering features dynamically via the displayFilterInfo property of the layer. Simply set the mode of the display filter to scale, then provide an array of scale ranges and SQL where clauses to filter features based on the given scale range.
Notice how each filter is more inclusive of road types as the scale ranges represent larger scales. This means as the user zooms in, they will see more detailed road types. And as they zoom out, the detail will be filtered out.
29 collapsed lines
<html> <head> <meta charset="utf-8" /> <meta name="viewport" content="width=device-width, initial-scale=1, shrink-to-fit=no" /> <title>Highways in Singapore</title>
<link rel="stylesheet" href="https://js.arcgis.com/5.1/esri/themes/light/main.css" /> <!-- Load the ArcGIS Maps SDK for JavaScript from CDN --> <script type="module" src="https://js.arcgis.com/5.1/"></script>
<script type="module"> const [MapView, WebMap, FeatureLayer, reactiveUtils] = await $arcgis.import([ "@arcgis/core/views/MapView.js", "@arcgis/core/WebMap.js", "@arcgis/core/layers/FeatureLayer.js", "@arcgis/core/core/reactiveUtils.js", ]);
const highwaysLayer = new FeatureLayer({ portalItem: { id: "a9f8d83a69fc4f2c92e5f83f87df6aaf", }, minScale: 1000000, maxScale: 0, });
highwaysLayer.displayFilterInfo = { mode: "scale", filters: [ { title: "Large highways", minScale: Infinity, maxScale: 150000, where: "highway IN ('motorway')", }, { title: "Small highways", minScale: 150000, maxScale: 60000, where: "highway IN ('motorway', 'trunk', 'trunk_link')", }, { title: "Major roads", minScale: 60000, maxScale: 45000, where: "highway IN ('motorway', 'motorway_link', 'trunk', 'trunk_link', 'primary', 'primary_link')", }, { title: "Roads", minScale: 45000, maxScale: 30000, where: "highway IN ('motorway', 'motorway_link', 'trunk', 'trunk_link', 'primary', 'primary_link')", }, { title: "Smallest roads", minScale: 30000, maxScale: 10000, where: "highway IN ('motorway', 'motorway_link', 'trunk', 'trunk_link', 'primary', 'primary_link', 'secondary', 'secondary_link')", }, { title: "all", minScale: 10000, maxScale: 0, }, ], };41 collapsed lines
const view = new MapView({ container: "viewDiv", map: new WebMap({ basemap: "gray-vector", layers: [highwaysLayer], }), constraints: { snapToZoom: false, }, viewpoint: { rotation: 0, scale: 175000, targetGeometry: { type: "point", spatialReference: { latestWkid: 3857, wkid: 102100, }, x: 11557036.825180829, y: 147507.71438237422, }, }, }); </script>
<style> html, body, #viewDiv { height: 100%; margin: 0; } </style> </head>
<body> <div id="viewDiv"></div> </body></html>Related samples and resources
API support
The following table describes the geometry and view types that are suited well for each visualization technique.
| 2D | 3D | Points | Lines | Polygons | Mesh | Client-side | Server-side | |
|---|---|---|---|---|---|---|---|---|
| | | | | | | | | |
| | | | | | | | | |
| | | | | | | | | |
| | | | | | | | | |
| | | | | | | | | |
| | | | | | | | | |
| | | | ||||||
| | | | | | | | |
- Feature reduction selection not supported
- Only by feature reduction selection
- Only by scale-driven filter