Magnitude 4.0 earthquakes and greater (1970 - 2019). Brighter areas indicate areas that have more earthquakes than others.
What is bloom?
Bloom is a layer effect that brightens symbols representing a layer’s features, making them appear to glow. This has an additive effect so areas where more features overlap will have a brighter and more intense glow. This makes bloom an effective way for visualizing dense datasets.
How bloom works
The bloom effect is controlled with three parameters and looks best on dark backgrounds.
bloom(strength, radius, threshold)
| Parameter | Description |
|---|---|
| strength | Determines the intensity of the bloom effect as a factor or percentage. The higher the strength, the brighter the glow. |
| radius | Determines the spread of light in the accepted range 0px-1px. Default value is 0. Negative values are not allowed. Leaves the features inside the radius untouched. |
| threshold | Colors with this brightness value or higher will have the bloom effect applied. |
The bloom effect can be sensitive to scale, density, and color. Effectively using bloom is often done through trial and error. The parameters that work well for one layer are often not suitable for other layers.
Examples
Points
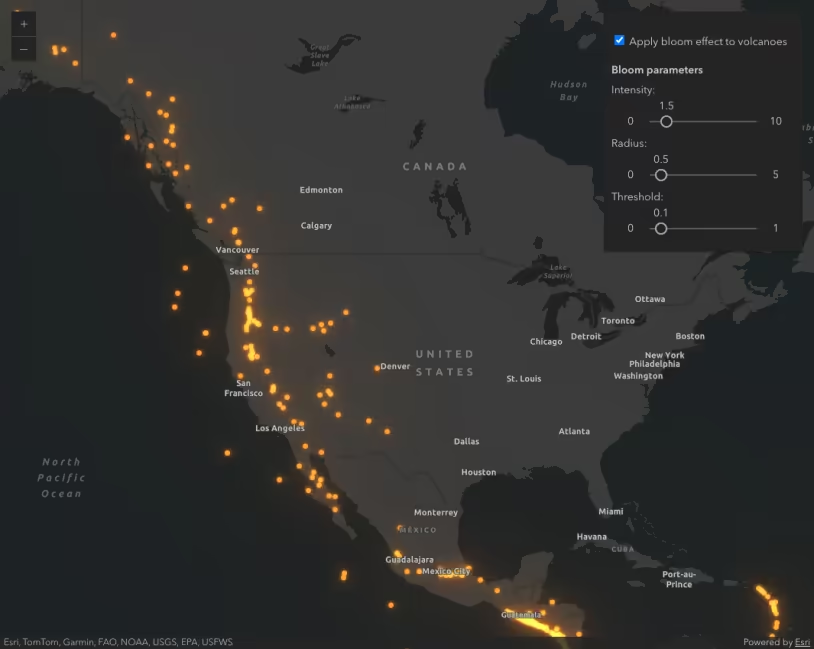
The following example demonstrates how to use bloom to show the density of overlapping points representing nearly 50 years of earthquakes.
- Create a simple renderer with a very small symbol size (e.g. 1 or 2 pixels) and apply it to the layer.
- Set the bloom effect on the layer. At a global scale with lots of points, the radius should be small (e.g. 0.1px). The threshold depends on the choice of color for the renderer. A lower number captures more colors (e.g. 15%).
Magnitude 4.0 earthquakes and greater (1970 - 2019). Brighter areas indicate areas that have more earthquakes than others.
19 collapsed lines
<html> <head> <meta charset="utf-8" /> <meta name="viewport" content="width=device-width, initial-scale=1, shrink-to-fit=no" /> <title>Magnitude 4.0 earthquakes</title>
<link rel="stylesheet" href="https://js.arcgis.com/5.1/esri/themes/dark/main.css" /> <!-- Load the ArcGIS Maps SDK for JavaScript from CDN --> <script type="module" src="https://js.arcgis.com/5.1/"></script>
<script type="module"> const [MapView, Map, SpatialReference, FeatureLayer] = await $arcgis.import([ "@arcgis/core/views/MapView.js", "@arcgis/core/Map.js", "@arcgis/core/geometry/SpatialReference.js", "@arcgis/core/layers/FeatureLayer.js", ]);
const earthquakesLayer = new FeatureLayer({ url: "https://services.arcgis.com/6DIQcwlPy8knb6sg/arcgis/rest/services/quakes/FeatureServer/0/", renderer: { type: "simple", symbol: { type: "simple-marker", color: "#fd7f6f", size: 1, outline: null, }, }, });
earthquakesLayer.effect = "bloom(1.3, 0.1px, 15%)";
79 collapsed lines
const viewSpatialReference = new SpatialReference({ wkid: 8857, }); let centerPoint = { x: 0, y: 0, spatialReference: viewSpatialReference, };
const countriesLayer = new FeatureLayer({ portalItem: { id: "2b93b06dc0dc4e809d3c8db5cb96ba69", }, renderer: { type: "simple", symbol: { type: "simple-fill", color: "rgba(75,75,75,1)", outline: { color: [255, 255, 255, 0.1], width: 0.5, }, }, }, });
const view = new MapView({ container: "viewDiv", map: new Map({ layers: [countriesLayer, earthquakesLayer], }), spatialReference: viewSpatialReference, center: centerPoint, scale: 206418924, constraints: { snapToZoom: false, minScale: 1100424194, }, });
view.graphics.add({ symbol: { type: "simple-fill", color: null, outline: { width: 0.5, color: [208, 208, 203, 0.7], }, }, geometry: { type: "extent", xmin: -180, xmax: 180, ymin: -90, ymax: 90, // This geometry automatically reprojects // when added to the view spatialReference: SpatialReference.WGS84, }, }); </script>
<style> html, body, #viewDiv { background-color: rgba(50, 50, 50, 1); height: 100%; margin: 0; } </style> </head>
<body> <div id="viewDiv"></div> </body></html>Lines
The following example demonstrates how to use bloom to show the density of overlapping lines representing Florida highways. Thick lines and lines that overlap will have a brighter appearance than thin non-overlapping lines.
- Create a simple, unique value, or a class breaks renderer and set it on the layer.
- Set the bloom effect on the layer.
Annual average daily traffic in Florida highways. The color of the symbol indicates the jurisdiction of each highway.
18 collapsed lines
<html> <head> <meta charset="utf-8" /> <meta name="viewport" content="width=device-width, initial-scale=1, shrink-to-fit=no" /> <title>Florida Annual Average Daily Traffic</title>
<link rel="stylesheet" href="https://js.arcgis.com/5.1/esri/themes/dark/main.css" /> <!-- Load the ArcGIS Maps SDK for JavaScript from CDN --> <script type="module" src="https://js.arcgis.com/5.1/"></script>
<script type="module"> const [MapView, WebMap, FeatureLayer] = await $arcgis.import([ "@arcgis/core/views/MapView.js", "@arcgis/core/WebMap.js", "@arcgis/core/layers/FeatureLayer.js", ]);
const highwaysLayer = new FeatureLayer({ portalItem: { id: "cca8f554a0764b94b35f8b1781e399de", }, effect: "bloom(1, 0px, 1%)", });31 collapsed lines
const view = new MapView({ container: "viewDiv", map: new WebMap({ portalItem: { id: "41b13aa63483457cafe2b40f38fa098c", }, layers: [highwaysLayer], }), constraints: { snapToZoom: false, minScale: 11424194, }, }); </script>
<style> html, body, #viewDiv { height: 100%; margin: 0; } </style> </head>
<body> <div id="viewDiv"></div> </body></html>Related samples and resources
API support
The following table describes the geometry and view types that are suited well for each visualization technique.
| 2D | 3D | Points | Lines | Polygons | Mesh | Client-side | Server-side | |
|---|---|---|---|---|---|---|---|---|
| | | | | | | | | |
| | | | | | | | | |
| | | | | | | | | |
| | | | | | | | | |
| | | | | | | | | |
| | | | | | | | | |
| | | | ||||||
| | | | | | | | |
- Feature reduction selection not supported
- Only by feature reduction selection
- Only by scale-driven filter