Percent of households with no vehicle available. Expand the layer list widget in the app to view the legend. As you zoom in, the same data will load with higher resolution geometries to provide more detail.
What is visible scale range?
A visible scale range defines the minimum and the maximum scales at which a dataset can be viewed.
Scale is a unitless way of describing how any distance on the map translates to a real-world distance. For example, a map at a 1:24,000 scale communicates that 1 unit on the screen represents 24,000 of the same unit in the real world. So one inch on the screen represents 24,000 inches in the real world.
Large scales display areas that are zoomed in, such as neighborhoods. Large scales allow you to view small areas so objects in the map (e.g. buildings) appear larger in the view.
Small scales display areas that are zoomed out, such as countries and continents. Small scales allow you to view more data. However, objects (e.g. buildings) appear smaller than they would in large scale maps.
| Small scale | Large scale |
|---|---|
| 1:72,876,217 | 1:8,000 |
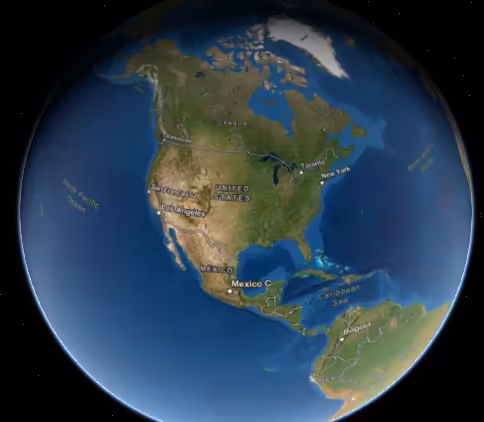 | 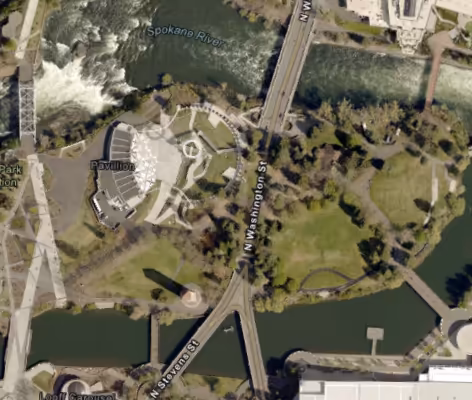 |
The concept of large scale vs. small scale can be confusing because the ArcGIS Maps SDK for JavaScript defines scale as a whole number using the denominator rather than the actual ratio it represents. For example, a view at a scale of 1:24,000 is defined as view.scale = 24000, not view.scale = 1/24000. Even though 24,000 is less than 4,000,000, a scale value of 24,000 is considered larger than a scale value of 4,000,000 because the fraction 1/24000 is larger than 1/4000000.
Why is visible scale range useful?
Some large datasets can’t be reasonably visualized at certain scales. For example, it doesn’t make sense to display census tracts at scales where you see the whole globe because tracts typically represent neighborhoods and small communities. Many polygons at that scale would be smaller than a pixel, making them useless to the end user.
Setting visible scale range on your layers also helps reduce the initial data download to the browser. Don’t display too much data if you don’t have to!
How visible scale range works
Visible scale range is defined on the layer with a minScale and a maxScale. minScale is the larger of the two numbers and defines the farthest the user can zoom out to view the layer. maxScale is the smaller of the two numbers and defines the farthest the user can zoom in to view the layer. Oftentimes the maxScale can remain undefined or 0. Setting the minScale will make the most difference in reducing download size.
Examples
One variable, multiple layers
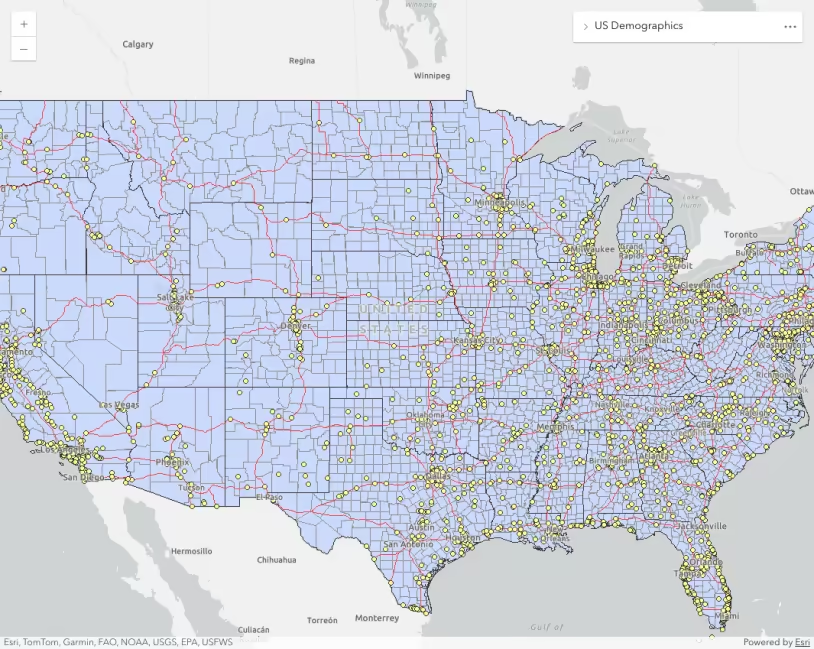
The following example demonstrates how to visualize the same data variable at multiple resolutions by setting visible scale ranges on layers representing U.S. states, counties, and census tracts. This requires that the data is properly aggregated within each layer.
Open the CodePen and reset the minScale and maxScale on each layer to 0 to observe how this affects the visualization.
Percent of households with no vehicle available. Expand the layer list widget in the app to view the legend. As you zoom in, the same data will load with higher resolution geometries to provide more detail.
23 collapsed lines
<html> <head> <meta charset="utf-8" /> <meta name="viewport" content="width=device-width, initial-scale=1, shrink-to-fit=no" /> <title>Visible scale range</title>
<link rel="stylesheet" href="https://js.arcgis.com/5.1/esri/themes/light/main.css" /> <!-- Load the ArcGIS Maps SDK for JavaScript from CDN --> <script type="module" src="https://js.arcgis.com/5.1/"></script>
<script type="module"> const [MapView, Map, SpatialReference, FeatureLayer, LayerList, Expand] = await $arcgis.import([ "@arcgis/core/views/MapView.js", "@arcgis/core/Map.js", "@arcgis/core/geometry/SpatialReference.js", "@arcgis/core/layers/FeatureLayer.js", "@arcgis/core/widgets/LayerList.js", "@arcgis/core/widgets/Expand.js", ]);
const effect = "drop-shadow(4px, 4px, 2px, rgb(100,100,100))";
const url = "https://services.arcgis.com/P3ePLMYs2RVChkJx/ArcGIS/rest/services/ACS_Vehicle_Availability_Boundaries/FeatureServer";
const statesLayer = new FeatureLayer({ url, layerId: 0, minScale: 0, maxScale: 30000001, effect, }); const countiesLayer = new FeatureLayer({ url, layerId: 1, minScale: 30000000, maxScale: 2000001, effect, }); const tractsLayer = new FeatureLayer({ url, layerId: 2, // This prevents the app from loading all census tracts at small scales minScale: 2000000, maxScale: 0, effect, });65 collapsed lines
const viewSpatialReference = new SpatialReference({ wkid: 5070, }); let centerPoint = { x: 0, y: 0, spatialReference: viewSpatialReference, };
const view = new MapView({ container: "viewDiv", map: new Map({ layers: [tractsLayer, countiesLayer, statesLayer], }), spatialReference: viewSpatialReference, viewpoint: { rotation: 0, scale: 34809209, targetGeometry: { type: "point", spatialReference: { wkid: 5070, }, x: -77487.07615764029, y: 1780211.54390861, }, }, });
const layerlist = new LayerList({ view, listItemCreatedFunction: (event) => { const item = event.item; item.panel = { content: "legend", }; }, });
view.ui.add( new Expand({ view, content: layerlist, }), "top-right", ); </script>
<style> html, body, #viewDiv { background-color: rgba(50, 50, 50, 1); height: 100%; margin: 0; } </style> </head>
<body> <div id="viewDiv"></div> </body></html>Related samples and resources
API support
The following table describes the geometry and view types that are suited well for each visualization technique.
| 2D | 3D | Points | Lines | Polygons | Mesh | Client-side | Server-side | |
|---|---|---|---|---|---|---|---|---|
| | | | | | | | | |
| | | | | | | | | |
| | | | | | | | | |
| | | | | | | | | |
| | | | | | | | | |
| | | | | | | | | |
| | | | ||||||
| | | | | | | | |
- Feature reduction selection not supported
- Only by feature reduction selection
- Only by scale-driven filter