This sample demonstrates how to dynamically create a series of charts in a PopupTemplate with an Arcade expression. To do this, expressions must be referenced in an ExpressionContent element and follow the rules specified in the Popup Element Arcade profile.
Expressions that return popup content elements must return a dictionary representing the web map specification of the desired content element. The following popup elements are supported: TextContent, FieldsContent, and MediaContent.
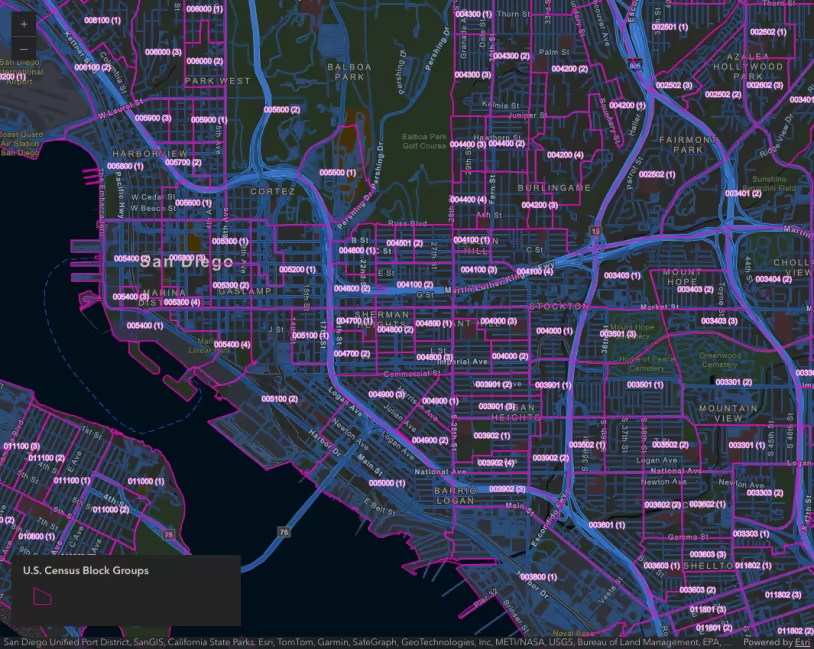
The map in this app contains two layers: a polygon layer representing block groups and a point layer representing the locations of crimes. Each crime has a desc_ field describing the type of crime committed. It also has a is_night field containing either a 1 (crime committed at night) or a 0 (crime committed during the day). An Arcade expression is set on the polygon layer’s popupTemplate and does the following:
- Query the crimes that intersect a selected polygon.
- Query the count of each crime type and the total that occurred at night.
- List the top three crimes in a FieldsContent element.
- Create a pie chart for each of the 3 top crimes indicating the number that happened in the daytime versus nighttime.
Create a fields content element with Arcade
Expressions for building a FieldsContent element must return a dictionary matching the following its associated webmap specification:
return { type: "fields", // defines variables calculated by the expression attributes: { field1: "value", field2: "value" }, // the attributes to include in the fields table fieldInfos: [{ fieldName: "field1" }, { fieldName: "field2" }],};The following expression demonstrates how this works. Read the comments for details.
// create an object to store attributes// and an array used to store field names for the titlevar attributes = {};var fieldInfos = [];
// Query the number of crimes that intersect a selected polygonvar crimes = Intersects(  $feature,  FeatureSetByName($map, "San Diego crimes", ["desc_"]));
// Queries the count of crimes grouped by the "desc_" fieldvar stats = GroupBy(crimes, ["desc_"],  [{ name: "total", expression: "1", statistic: "count" }]);
// Orders the results in descending order by the total count// excludes crimes that don't have a classificationvar topCrimes = Top(OrderBy(Filter(stats, "desc_ <> ''"), "total desc"), 3);
if(Count(topCrimes) == 0){  return {    type: "text",    text: "No crimes committed in this area"  };}// iterate through each crime, add its count to the attributes// and create an associated fieldInfo to include it in the tablefor(var item in topCrimes){  var num_crimes = item.total;  var crimeType = item["desc_"];  attributes[crimeType] = num_crimes;  Push(fieldInfos, {    fieldName: crimeType  });}
// return the fieldInfos as defined// by the FieldsContent specificationreturn {  type: "fields",  fieldInfos: fieldInfos,  attributes: attributes};
Create charts with Arcade
Expressions for charts must return a dictionary matching the web map specification of a MediaContent element:
return { type: "media", // defines attribute values calculated in the expression // values for all charts must be included here attributes: { field1: number, field2: number }, title: "Media content title", mediaInfos: [ { type: "piechart", // can also be "columnchart", "linechart", "piechart", "image" title: "Chart title", value: { // the list of attribute values to include in the chart fields: [ "field1", "field2" ] } } // you can define more charts here ]}When implemented in JavaScript, the charts can be defined with a list of field names. However, when dynamically creating charts with Arcade, you must create an attributes dictionary that stores key-value pairs containing the data to use in the charts. The keys are the field names to reference in the fields property of each chart’s value.
The following expression demonstrates how this works by creating a column chart comparing the counts of each crime type and three pie charts for showing the number of crimes that happened during the daytime vs. nighttime for each type. Read the comments for details.
// create an object to store attributes// and arrays used to store field names for each chartvar attributes = {};var totalFields = [];var firstCrimeFields = [];var secondCrimeFields = [];var thirdCrimeFields = [];
// Query the number of crimes that intersect a selected polygonvar crimes = Intersects(  $feature,  FeatureSetByName($map,"San Diego crimes", ["desc_", "is_night"]));
// Queries the count of crimes and the number that occurred// at night grouped by the "desc_" fieldvar stats = GroupBy(crimes, ["desc_"],  [    { name: "total", expression: "1", statistic: "count" },    { name: "night", expression: "is_night", statistic: "sum" }  ]);
// Orders the results in descending order by the total count// excludes crimes that don't have a classificationvar topCrimes = Top(OrderBy(Filter(stats, "desc_ <> ''"), "total desc"), 3);
if(Count(topCrimes) == 0){  return {    type: "text",    text: "No crimes committed in this area"  };}
// iterate through each crime type, adding each crime's statistic// to the attributes dictionary and to the appropriate// chart's fieldNames arrayvar i = 0, firstCrime, secondCrime, thirdCrime;for(var t in topCrimes){  i++;  var type = t.desc_;  var night = t.night;  var daytime = t.total - t.night;  attributes[type] = t.total;  Push(totalFields, type);
  var nightFieldName = `Total of crime ${i} that occurred at night`;  var dayFieldName = `Total of crime ${i} that occurred in daytime`;
  attributes[nightFieldName] = night;  attributes[dayFieldName] = daytime;
  if(i == 1){    firstCrime = type;    Push(firstCrimeFields, nightFieldName);    Push(firstCrimeFields, dayFieldName);  }  if(i == 2){    secondCrime = type;    Push(secondCrimeFields, nightFieldName);    Push(secondCrimeFields, dayFieldName);  }  if(i == 3){    thirdCrime = type;    Push(thirdCrimeFields, nightFieldName);    Push(thirdCrimeFields, dayFieldName);  }}
// Add the attributes to the media element// create each chart, specifying its type// and setting the fields needed for it to renderreturn {  type: "media",  attributes: attributes,  title: "Crime Summary",  mediaInfos: [{    type: "columnchart",    value: {      fields: totalFields    }  }, {    type: "piechart",    title: firstCrime,    value: {      fields: firstCrimeFields    }  }, {    type: "piechart",    title: secondCrime,    value: {      fields: secondCrimeFields    }  }, {    type: "piechart",    title: thirdCrime,    value: {      fields: thirdCrimeFields    }  }]};
The expressions are added directly to an ExpressionContent element within the popupTemplate content.
// get the expressions from scripts defined outside JavaScriptconst arcadeFields = document.getElementById("crimes-list").text;const arcadeChart = document.getElementById("crimes-chart").text;
blockGroup.popupTemplate = {  title: "Top 3 crimes",  content: [    {      type: "expression",      expressionInfo: {        expression: arcadeFields,      },    },    {      type: "expression",      expressionInfo: {        expression: arcadeChart,      },    },  ],};
Related samples and resources
Popup charts for clusters
Summarize intersecting points in a popup