Note: Sign in to access the data in this sample. username: viewer01 password: I68VGU^nMurF
Getting Started
A knowledge graph allows you work with a graph network.
This network connects people, places, and things
(represented by entities) with each other through
relationships that define how they are associated.
Both entities and relationships can have associated properties.
An entity with a spatial location can be connected with other entities that do not have a spatial location.
This sample demonstrates the two methods for querying a knowledge graph: executeQuery() and executeQueryStreaming(). Both query and streaming query use an Esri implementation of openCypher to find patterns in graph data.
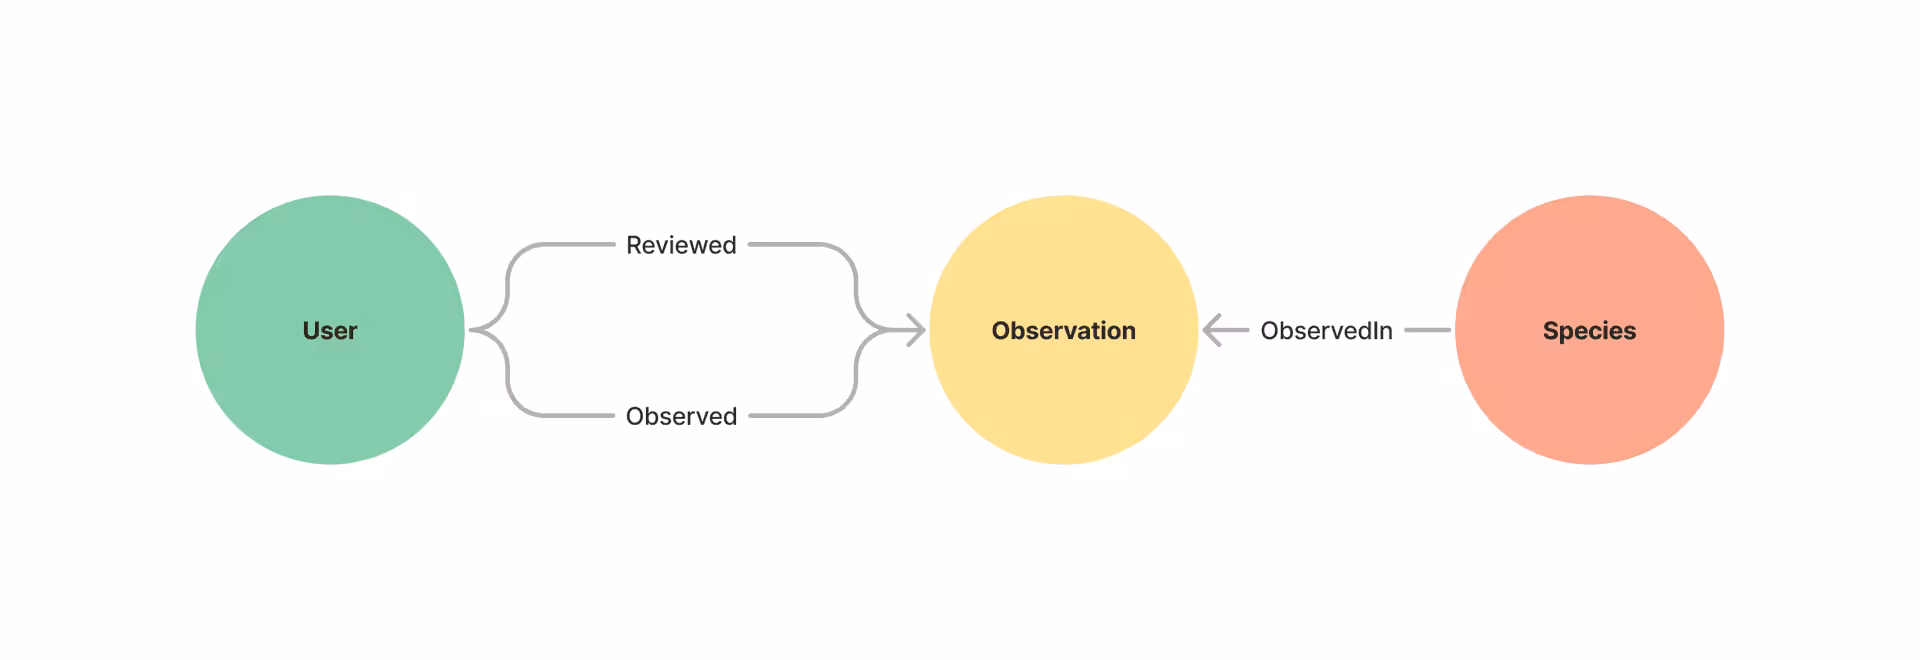
The sample dataset contains observations of bumble bees made at locations around the United States. Each observation was made and verified by users and is of a specific species of bumble bee.
For additional information on working with knowledge graph services see:
- Write an openCypher query for more on working with openCypher and knowledge graphs.
- Introduction to Knowledge Graph in the JavaScript Maps SDK.
- Search a knowledge graph
- Edit knowledge graph data
- Working with knowledge graph layer
- Get started with ArcGIS Knowledge Server for overview of ArcGIS Knowledge for ArcGIS Enterprise.
- Hosted Knowledge Graph Service for information on managing knowledge graph services via ArcGIS Enterprise and the REST API.
- Get started with ArcGIS Knowledge (ArcGIS Pro) for information on ArcGIS Knowledge in ArcGIS Pro.
How to use this sample
Sign in
The data in this example is secured, as most knowledge graph data will be since the ArcGIS Knowledge Graph Server license is required. Therefore, the first step is to sign in to load the data.
In this sample sign in with the following credentials: username: viewer01 password: I68VGU^nMurF.
After signing in, the results section will update with the data model and service definition of the knowledge graph.
Query
The query defines the graph pattern to match. This pattern is a traversal of entity types and relationships that connect them.
In this sample, the default pattern is to match any entities of the type user that are related to Observation entities through an observed or reviewed relationship.
The relationship direction specifies that we are only interested in relationships going from User to Observation.
The next part of the query is any conditions to apply to the pattern. The condition can be on any property of the entities or
relationships in the pattern. In this example we are only interested in the Observation entities and their related users within
a specific geographic area.
The streaming query accepts optional bind parameters as variables in the query string. Bind parameters specify a set of data to be included in the query. They are particularly helpful when trying to execute a query with a very large argument, such as a large set of IDs or intersecting a complex geometry. The geometry can be defined separately and included in the query with a variable.

To use a geometry bind parameter, the entity type in the where clause must contain the shape property (indicating it is a spatial entity).
In this knowledge graph, the Observation entity type is the only spatial entity type.
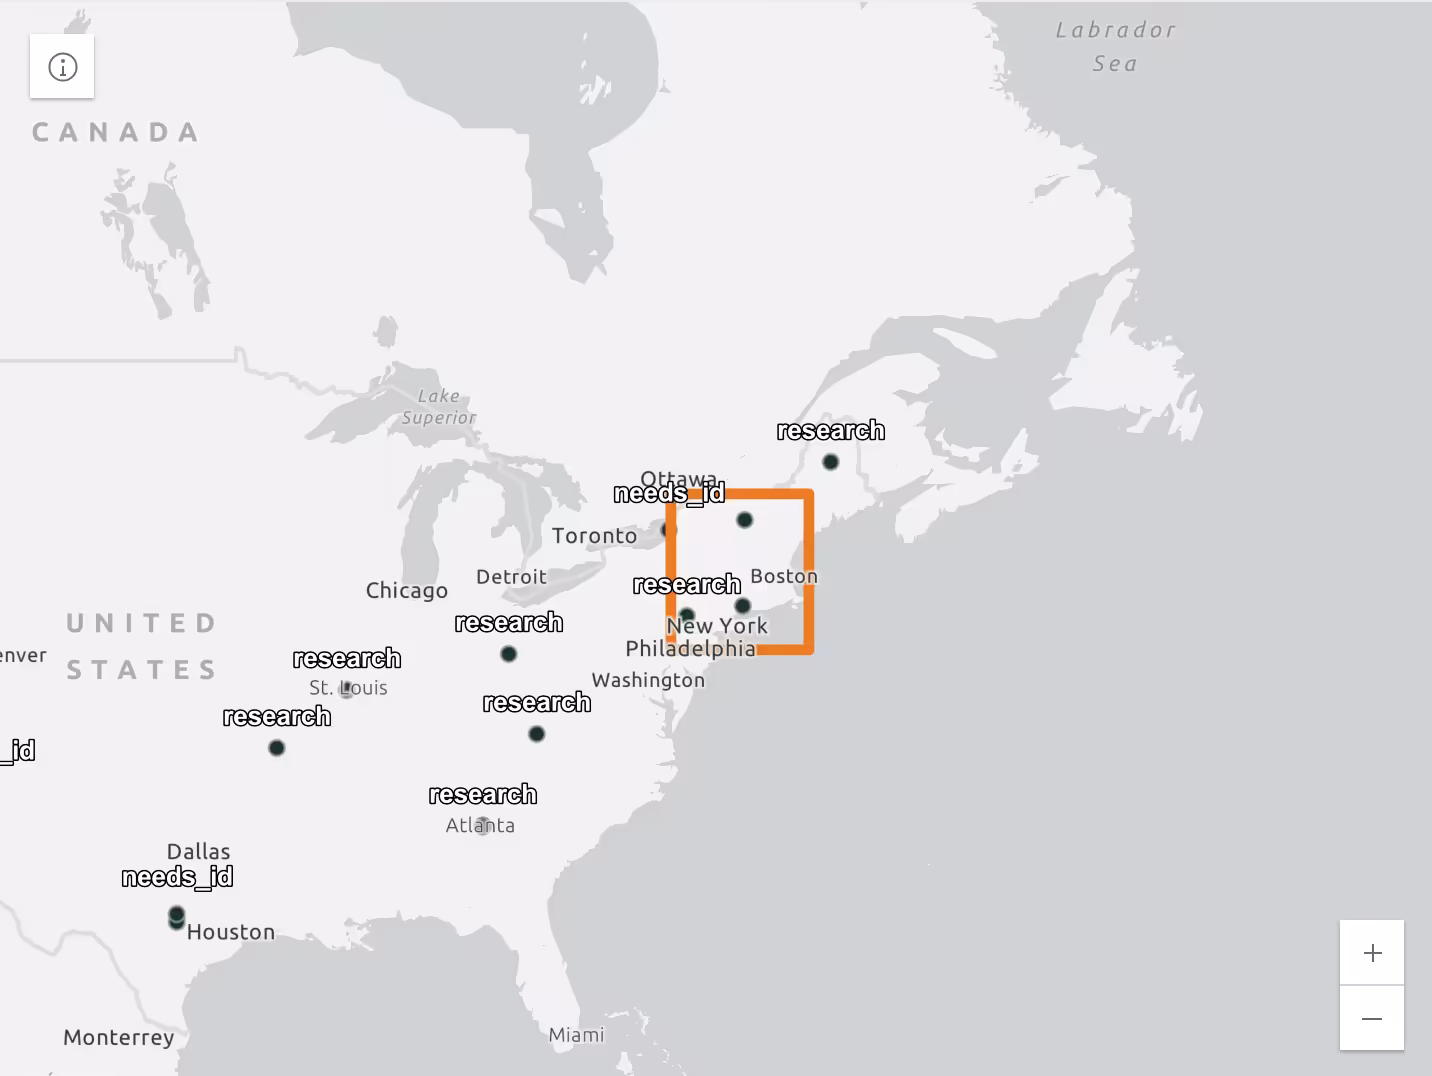
This query returns the users who made or verified observations within the bounding polygon. The map provides the polygon to use in the spatial query. Change the location or size of the polygon to modify the query results.
See bindParameters for more information.
Note: ArcGIS Knowledge does not support all aspects of the openCypher query language. For example, queries can’t be used to update the knowledge graph, only to return values. See Write an openCypher query for more on working with openCypher and knowledge graphs.
How it Works
The first step is to connect to a knowledge graph using fetchKnowledgeGraph.
// set knowledge graph with url to service const url = "https://sampleserver7.arcgisonline.com/server/rest/services/Hosted/BumbleBees/KnowledgeGraphServer"; const knowledgeGraph = await KGModule.fetchKnowledgeGraph(url);Streaming query
returns results in small chunks allowing the client
to begin processing the data returned immediately rather than waiting for the entire result set to be returned before processing.
Streaming is faster, more efficient, and will retrieve all matching records, even if the total exceeds query limits set in the service definition.
Another benefit of streaming is that the request is encoded which means that it is far smaller than a traditional
HTTP GET or JSON POST body. This is especially important when trying to do a query on a very large argument,
such as a large set of IDs or intersecting a complex geometry.
In this example the query returns users who have made or verified observations of bumblebees within a
specific geographic area and generates a link chart showing how they are connected. This geographic area is denoted by a variable in the query string, with the
geometry defining the area attached to the query through a bind parameter.
MATCH (A:User) - [R:Observed | Reviewed] -> (B:Observation) WHERE esri.graph.ST_Intersects($userGeometry, B.shape) RETURN A LIMIT 10
      /**       * Streaming query to return the selected entities or relationships that match the pattern defined in the query.       * It uses the bindParameter property to either bind geometry from the sketch on the map to the query to perform a spatial query on the graph       * or to bind a list of ids to query within.       * Streaming query has more options to refine the query results.       * Streaming query also has much higher performance when working with large datasets.       * It returns the data in chunks that can be processed as they are returned.       */      const executeQuery = async () => {        const bindParameters = {};        //create a geometry from the sketch layer as the bind parameter        const rings = [];
        for (const graphic of graphicsLayer.graphics.items) {          //convert the geometry to wgs84 if necessary          const geom = graphic.geometry.spatialReference.isWGS84            ? graphic.geometry            : webMercatorUtils.webMercatorToGeographic(graphic.geometry);          rings.push(geom.rings[0]);        }
        bindParameters["userGeometry"] = new Polygon({ rings: rings });        //execute the query and display the results        const queryResults = await KGModule.executeQueryStreaming(knowledgeGraph, {          openCypherQuery:            "MATCH path=(A:User) - [] -> (B:Observation) WHERE esri.graph.ST_Intersects($userGeometry, B.shape) RETURN path",          bindParameters: bindParameters,        });        newLayer = true;        readStream(queryResults);      };
Each chunk returned by a streaming query is a readable stream that must be read before the results can be used. After the chunk is read it can be used in other client side processing. In this case it is used to add records to a link chart to show the relationships between the users who made or reviewed the observations in the areas of interest.
      // a function to read the stream returned from the streaming search      const readStream = async (streamingQueryResult, method) => {        //create the reader        let reader = streamingQueryResult.resultRowsStream.getReader();        let resultRows = [];        //try to read the stream        try {          while (true) {            //read the stream            const { done, value } = await reader.read();            //stop reader when the stream is done            if (done) {              break;            }
            updateLinkChart(value);            newLayer = false;            //create the output list from the read stream.          }          // if there is an error in returning the stream or the stream is aborted        } catch (err) {          if (err.name === "AbortError") {            console.log("Request aborted as expected");          } else {            throw err;          }        }      };