This sample shows how to access the temporal data of a VoxelLayer and use it with the Time Bar component.
A VoxelVariable has one of the following volumeType xyz, xyzt or xyt. The x, y and z represent a geographic coordinate and t represents time. A volumeType of xyzt adds time as the fourth dimension and makes the VoxelLayer a time-aware layer. The volumeType xyt is not a time-aware layer. The time is represented along the z dimension. The stops in the timeInfo returns the time instants the VoxelLayer has data for.
      const voxelVolume = voxelLayer.getVolume(null);      const volumeType = voxelVolume.volumeType;      // Check that the volume type is xyzt      if (volumeType === "xyzt") {        // Set the fullTimeExtent of the time bar based on the layer's timeInfo        timeBar.fullTimeExtent = voxelLayer.timeInfo.fullTimeExtent;
        // Configure the time bar to use the layer's timeInfo.stops        timeBar.stops = {          dates: voxelLayer.timeInfo.stops,        };
        // Configure the ticks labels based on the voxelLayer's timeInfo.stops        const dates = voxelLayer.timeInfo.stops;        const tickValues = dates.map((date) => date.getTime()).sort((first, second) => first - second);
        ticks.min = tickValues[0];        ticks.max = tickValues[tickValues.length - 1];        ticks.values = tickValues;
        // Show only the ticks at the values of the voxelLayer's timeInfo.stops        ticks.labelFormatter = (value) => {          const date = new Date(value);          if (date.getUTCFullYear() % 2 === 0) {            return `${date.getFullYear()}`;          } else {            return "";          }        };      }
In this sample, you can see overtime the underground soil contamination from chlorinated solvents with a value of 1000 µg/l in The Hague.
Related samples and resources
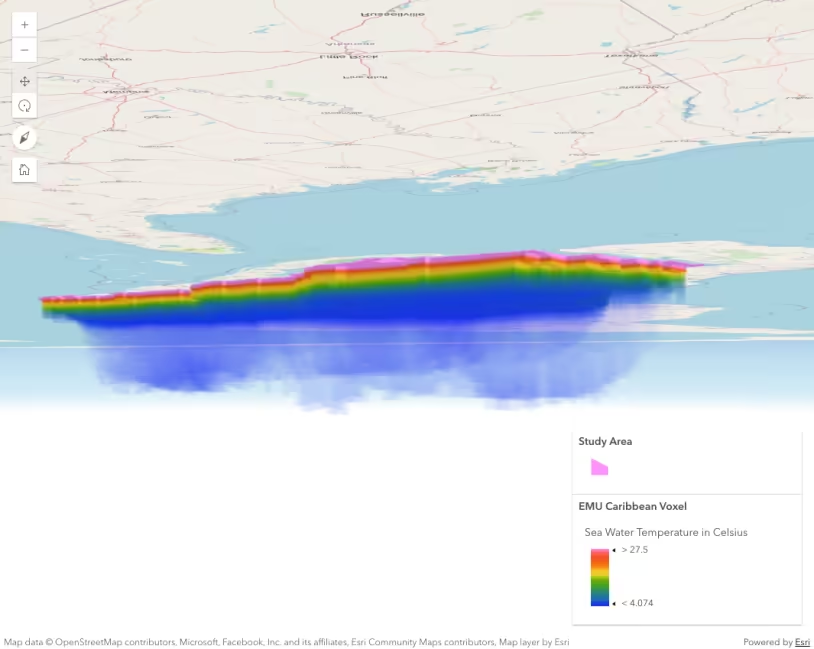
Intro to VoxelLayer
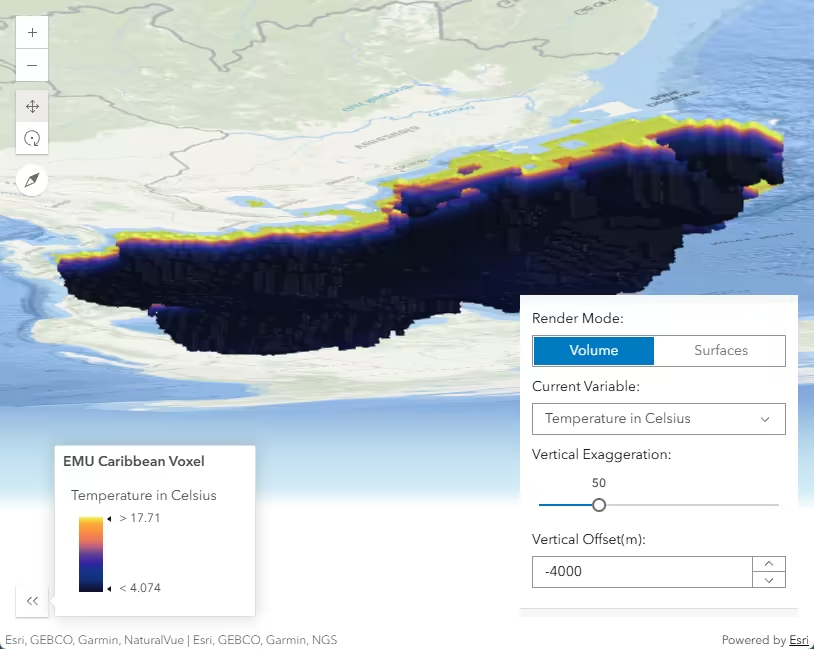
VoxelLayer variable and render mode

Configuring the popup of a VoxelLayer
