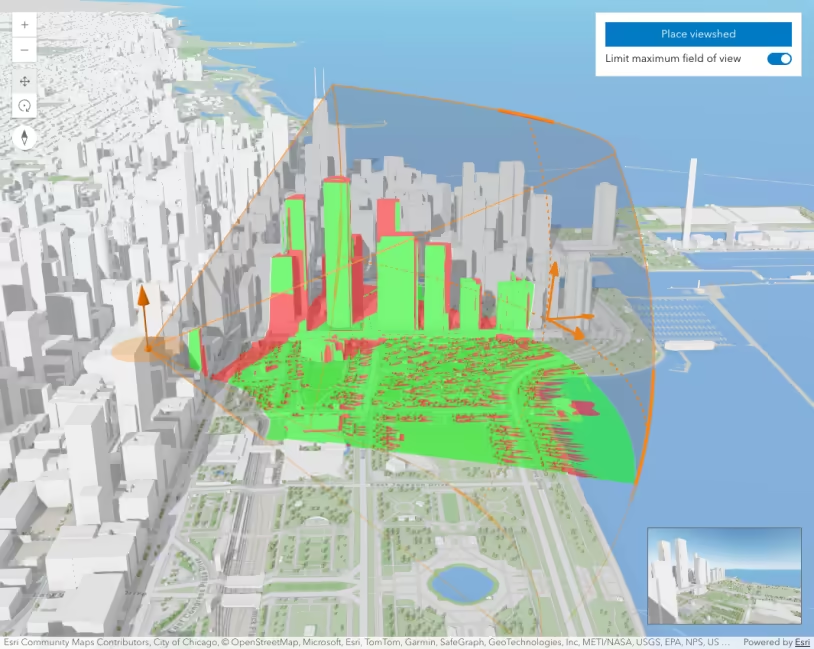
This sample demonstrates how to use the Line Of Sight component to check whether one or multiple targets are visible from an observer viewpoint in a Scene component.
In this sample, the observer is set on the upper floor of an existing building. The sample shows how the view of the observer is obstructed if a new building is constructed in front of it. Turn the development layer on and off to see how the view of the river gets obstructed. Move the observer or the targets to explore points where the view is not obstructed. Click on Continue analysis to add more targets to the analysis.
The component can be added to the Scene using the following code snippet:
<arcgis-scene item-id="82127fea11d6439abba3318cb93252f7"> <!-- include the Line Of Sight component inside the Scene component --> <arcgis-line-of-sight slot="top-right"></arcgis-line-of-sight></arcgis-scene>The LineOfSightAnalysis can be used to initially create an analysis instance defining an observer and several target points.
const analysis = new LineOfSightAnalysis({ observer: { position: new Point({ latitude: 42.3521, longitude: -71.0564, z: 139, }), }, targets: [ createTarget(42.3492, -71.0529), createTarget(42.3477, -71.0542), createTarget(42.3485, -71.0533), createTarget(42.3467, -71.0549), ],});The analysis is then added to the Scene and assigned to the Line Of Sight component.
// add the analysis to the SceneviewElement.analyses.add(analysis);// assign the analysis to the componentlineOfSightElement.analysis = analysis;
const analysisView = await viewElement.whenAnalysisView(analysis);
You can watch for changes in the result to update the symbols marking the intersections for the line of sight whenever the observer or targets are modified.
// watch for result changesreactiveUtils.watch(  () => analysisView.results.map((result) => result?.intersectedLocation),  () => {    viewElement.graphics.removeAll();
    analysisView.results.forEach((result) => {      if (result?.intersectedLocation) {        const graphic = new Graphic({          symbol: intersectionSymbol,          geometry: result.intersectedLocation,        });        viewElement.graphics.add(graphic);      }    });  },);
Related samples and resources
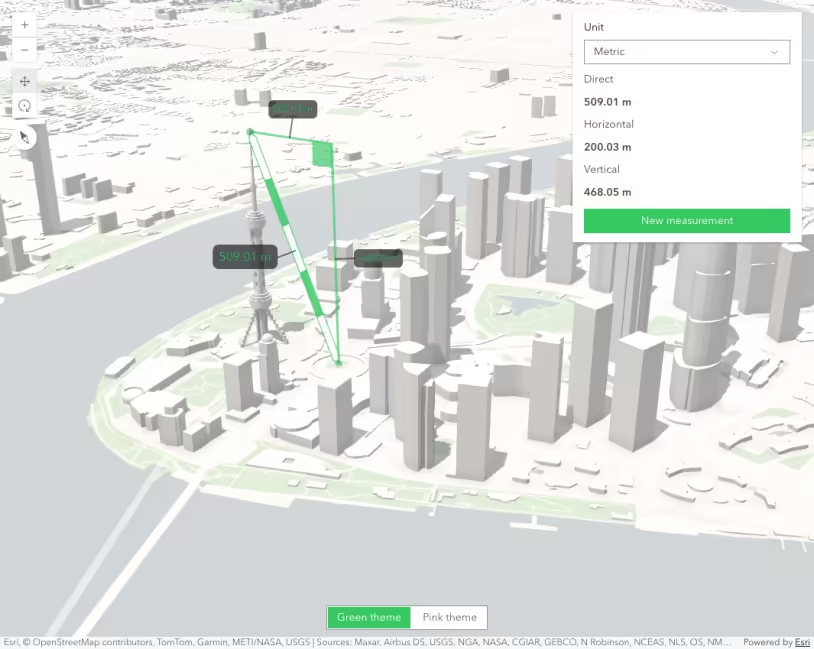
Measurement components in 3D
Color theming for interactive tools
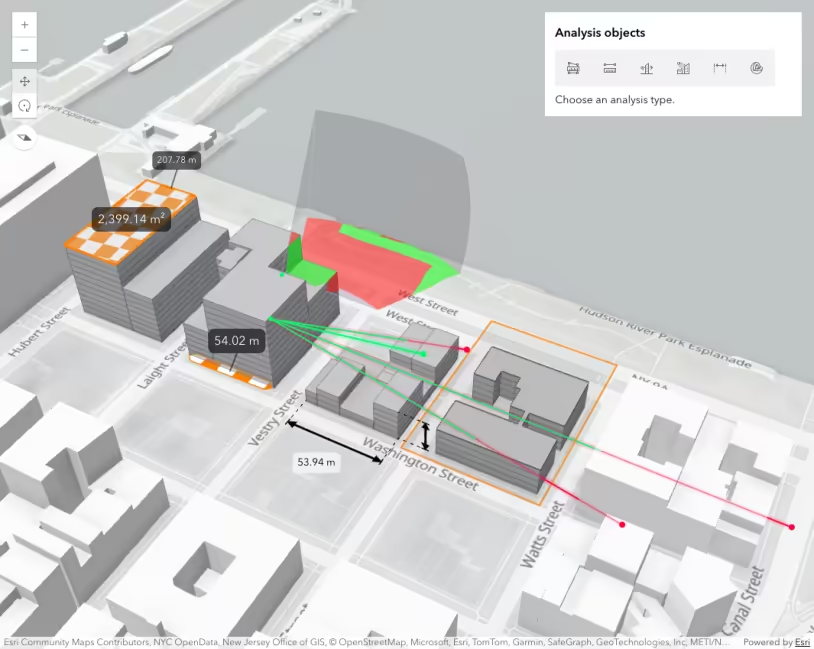
Analysis objects