You can perform many different types of analyses with the feature analysis service
The operations are categorized into the following:
Click on the links below to learn how to execute each operation programmatically with ArcGIS APIs
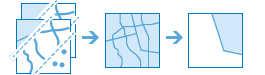
Find data
Find data operations allow you to find feature data
| Operation | Description | Input data | Output data | Example |
|---|---|---|---|---|
| Find existing locations | Selects features | Point, polyline, or polygon feature data | Point, polyline, or polygon feature data |
|
| Derive new locations | Selects and can modify features | Point, polyline, or polygon feature data | Point, polyline, or polygon feature data |  |
| Extract features | Selects and exports features | Point, polyline, or polygon feature data | Point, line, or polygon feature data |

|
Combine data
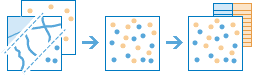
Combine data operations allow you to merge, overlay, and join multiple sources of feature data
| Operation | Description | Input data | Output data | Example |
|---|---|---|---|---|
| Merge layers | Combines two feature datasets | Point, polyline, or polygon feature data | Point, polyline, or polygon feature data |
|
| Overlay layers | Combines two or more feature datasets | Point, polyline, or polygon feature data | Point, polyline, or polygon feature data |

|
| Join features | Combines the attributes from one feature dataset | Point, polyline, polygon, or table feature data | Point, polyline, polygon, or table feature data |

|
| Dissolve boundaries | Combines polygons from feature datasets | Polygon feature data | Polygon feature data |

|
Summarize data
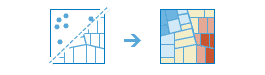
Summarize data operations allow you to calculate spatial and attribute statistics on feature data
| Operation | Description | Input data | Output data | Example |
|---|---|---|---|---|
| Aggregate points | Finds which points fall inside polygons using a point-in-polygon spatial relationship and returns new feature data | Point or polygon feature data | Polygon feature data |

|
| Summarize nearby | Finds features | Point, polyline, or polygon feature data | Point, polyline, or polygon feature data |

|
| Summarize within | Finds areas (and portions of areas) that overlap between two feature datasets | Polygon features Point, polyline, or polygon feature data | Point, polyline, or polygon feature data |

|
| Summarize center and dispersion | Finds central features | Point, line, or polygon feature data | Polygon feature data |

|
Analyze patterns
Analyze patterns operations allow you to perform complex geometry, attribute, and statistic calculations to identify spatial patterns and relationships in feature data. All operations result in new feature data
| Operation | Description | Input data | Output data | Example |
|---|---|---|---|---|
| Find hot spots | Finds spatially and statistically significant clusters of features | Point or polygon feature data | Point or polygon feature data |
|
| Find outliers | Finds spatial and statistical anomalies in clusters of feature data | Point or polygon feature data | Point or polygon feature data |

|
| Find point clusters | Finds clusters of point features at a specified distance and using unsupervised machine learning clustering algorithms and returns new feature data | Point feature data | Point feature data |

|
| Calculate density | Finds areas in feature data | Point or line feature data | Polygon feature data |

|
| Interpolate points | Finds and predicts new features | Point feature data | Polygon feature data |

|
Calculate geometries
Calculate geometries operations allow you to perform different types of geometric calculations on feature data and to create new feature data such as grids, tessellations, and bins.
| Operation | Description | Input data | Output data | Example |
|---|---|---|---|---|
| Create buffers | Creates areas at a distance around a point, line, or polygon feature | Point, polyline, or polygon feature data | Polygon feature data |

|
| Find centroids | Finds the representative center (centroid) of each multipoint, polyline, or polygon feature | Multipoint, point, polyline, or polygon feature data | Multipoint, point, polyline, or polygon feature data |

|
| Generate tessellations | Creates equally sized square, hexagon, triangle, or diamond geometry | Not required | Polygon feature data |

|