
What is feature analysis?
Feature analysis is the process of using the feature analysis service
Feature analysis can help solve many different types of problems. For example, you can use it to:
- Understand where features are or where multiple features exist.
- Measure sizes, shapes, and distributions of features.
- Analyze relationships and interactions between features.
- Detect and quantify patterns and relationships between features.
- Make predictions based on existing or theoretical patterns and relationships.
To learn more about spatial analysis concepts and use cases, go to the following resources:
To perform feature analysis, you typically provide your feature data
How to access the spatial analysis service
You can access a spatial analysis service if your ArcGIS account
To use this URL, you must be able to create an access token
- Spatial analysis > Feature analysis (
premium):user :spatialanalysis - Content > Create, update and delete (
portal):user :create Item - Content > Publish hosted feature layers (
portal):publisher :publish Features
To learn more, go to Security and Authentication guide > Privileges.
Request
https://www.arcgis.com/sharing/rest/portals/self?f=json&token={ACCESS_TOKEN}Response
{
"helperServices": {
// Other parameters...
"analysis": {
"url": "https://{YOUR_ANALYSIS_SERVICE}/arcgis/rest/services/tasks/GPServer"
}
}
}Types of feature analysis
Feature analysis operations for the feature analysis service
To learn more, click on the categories below:
| Category | Description | Operations | Result | Example |
|---|---|---|---|---|
| Find data | Selects a subset of features | Find, Derive, Extract | A new feature collection |

Finds existing polygons that match a SQL query. |
| Combine data | Combines or joins features from two or more feature datasets | Merge, Overlay, Join, Dissolve | A new feature collection |

Dissolves polygons from two input feature datasets. |
| Summarize data | Aggregates or summarizes feature data | Aggregate points, Summarize nearby, Summarize within, Summarize center and dispersion | A new feature collection |

Aggregate points into polygons. |
| Analyze patterns | Identifies spatial patterns and relationships in feature data | Find hot spots, Find outliers, Find point clusters, Calculate density, Interpolate points, Calculate composite index | A new feature collection |

Find hot spots based on attribute values |
| Calculate geometries | Performs geometric calculations on existing features | Create buffers, Create centroids, Generate tessellations, | A new feature collection |

Generate and merge buffers around features. |
Why use feature analysis?
You use feature analysis when you want to perform a server-side process on feature data. Feature data contains a collection of features, and each feature contains a geometry and set of attributes. This is different from geometry analysis which only involves processing geometries on the client-side. To see a comparison, go to Geometry vs feature analysis.
Below are reasons to use feature analysis and the feature analysis service
Large datasets
The feature analysis service
Learn more about supported data formats in Prepare feature data.
Hosted data
To perform an analysis, you can use a hosted feature layer
Learn more about how to use hosted feature layers in Data hosting.
Long transactions
To help with processing large amounts of feature data, the feature analysis service supports job requests
Learn more about managing job requests in Perform the analysis - ArcGIS REST API.
Manage results
When an analysis is complete, the feature analysis service
Learn more about accessing and managing hosted feature layers in Data hosting.
APIs
To access the analysis service there are a number of ArcGIS APIs you can use. This includes the ArcGIS API for Python, ArcGIS REST JS, and ArcGIS Maps SDK for JavaScript. Client APIs make it easy to implement authentication, access the service, and manage the job requests for each transaction. You can also access the service directly with the ArcGIS REST API.
To learn how to access the feature analysis service
Software and tools
You can also perform feature analyses interactively with ArcGIS tools such as Map Viewer
Limitations
Tutorials

Find data sources
Discover data in ArcGIS that you can use for feature analysis.


Enrich data sources
Enrich data with demographic information and local business facts using the spatial analysis service.

Perform a feature analysis
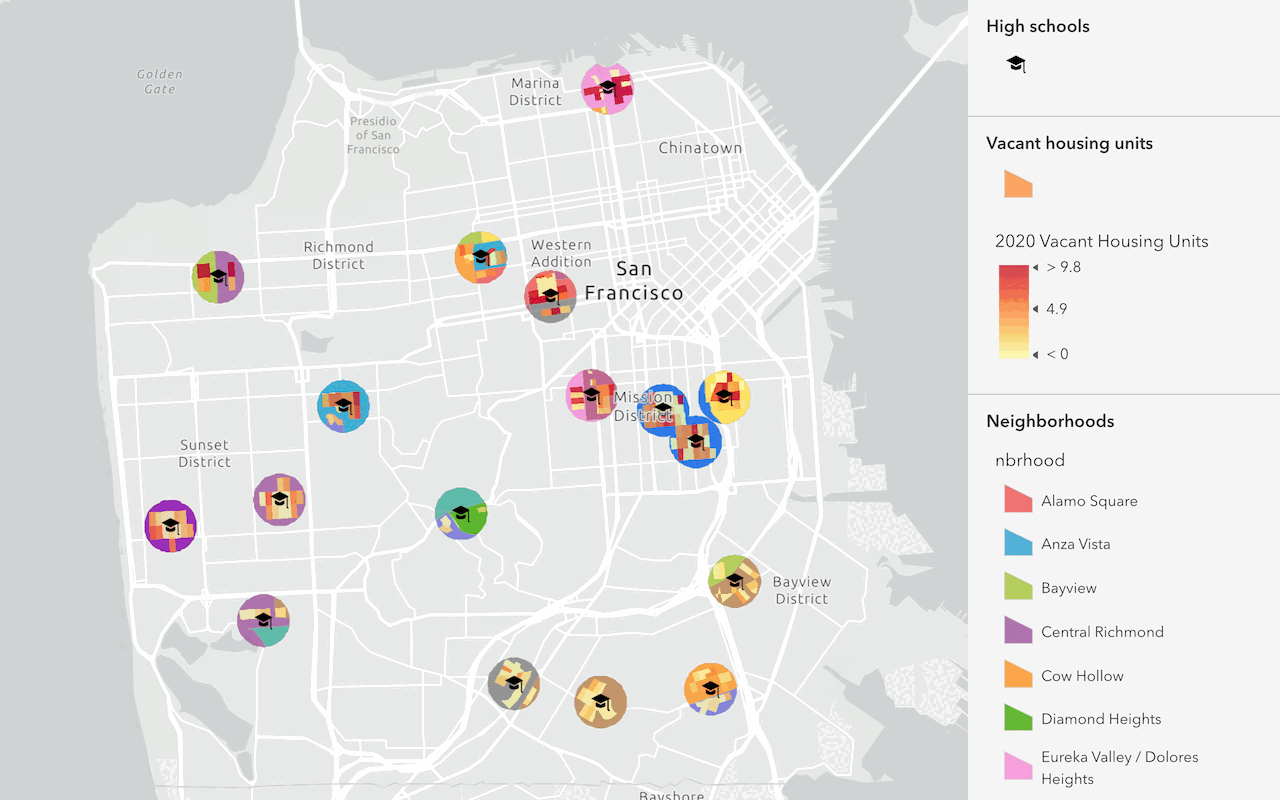
Find and extract data
Find data with attribute and spatial queries using find analysis operations.

Combine data
Overlay, join, and dissolve features using combine analysis operations.
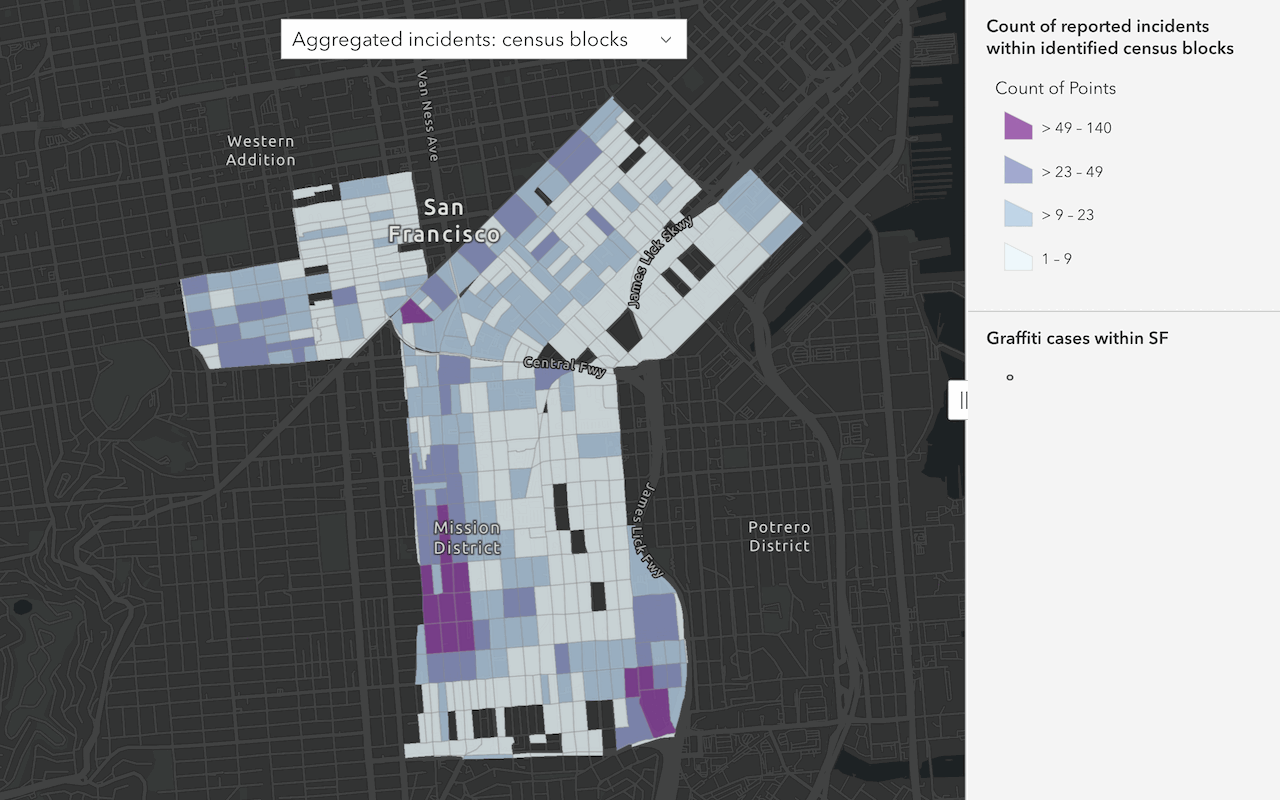
Summarize data
Aggregate and summarize features
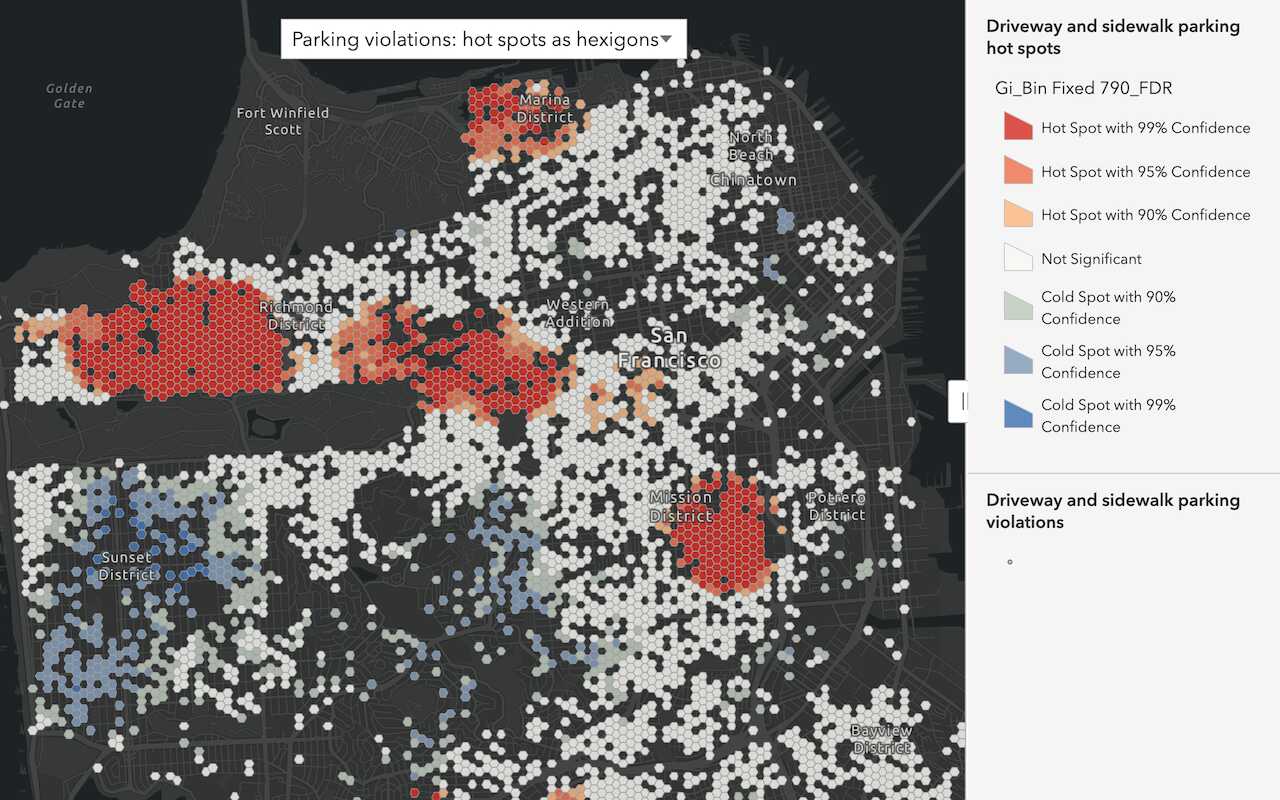
Discover patterns in data
Find patterns and trends in data using spatial analysis operations.
Services
API support
| Find data | Combine data | Summarize data | Analyze patterns | Calculate geometries | |
|---|---|---|---|---|---|
| ArcGIS Maps SDK for JavaScript | 1 | 1 | 1 | 1 | 1 |
| ArcGIS Maps SDK for .NET | |||||
| ArcGIS Maps SDK for Kotlin | |||||
| ArcGIS Maps SDK for Swift | |||||
| ArcGIS Maps SDK for Flutter | |||||
| ArcGIS Maps SDK for Java | |||||
| ArcGIS Maps SDK for Qt | |||||
| ArcGIS API for Python | |||||
| ArcGIS REST JS | 1 | 1 | 1 | 1 | 1 |
| Leaflet | 2 | 2 | 2 | 2 | 1 |
| MapLibre GL JS | 2 | 2 | 2 | 2 | 1 |
| OpenLayers | 2 | 2 | 2 | 2 | 1 |
- 1. Access with geoprocessing task
- 2. Access via ArcGIS REST JS