This topic provides an overview of the key concepts and terminology you should be familiar with before performing spatial analysis.
What is spatial analysis?
Spatial analysis is the process of using analytical techniques to find relationships, discover patterns, solve problems and derive insights with geographic data. The goal of every analysis is to turn data into information.
Some typical uses of spatial analysis include the following:
- Identify optimal locations for new housing developments based on factors like land use, transportation networks, and environmental constraints.
- Calculate slope, aspect and visibility, to assess the impact of natural disasters.
- Find suitable locations for facilities like retail stores, warehouse, or hospitals taking into account factors like population density, accessibility, and proximity to resources.
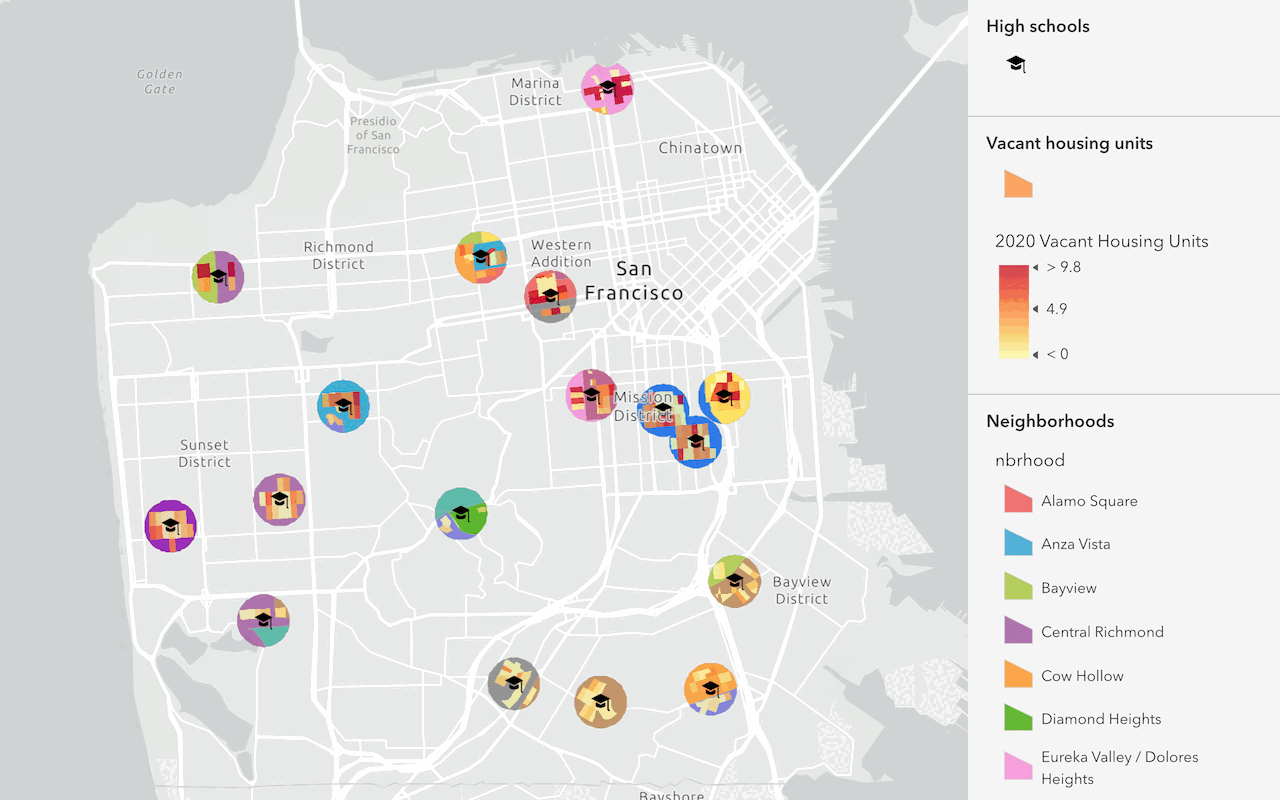
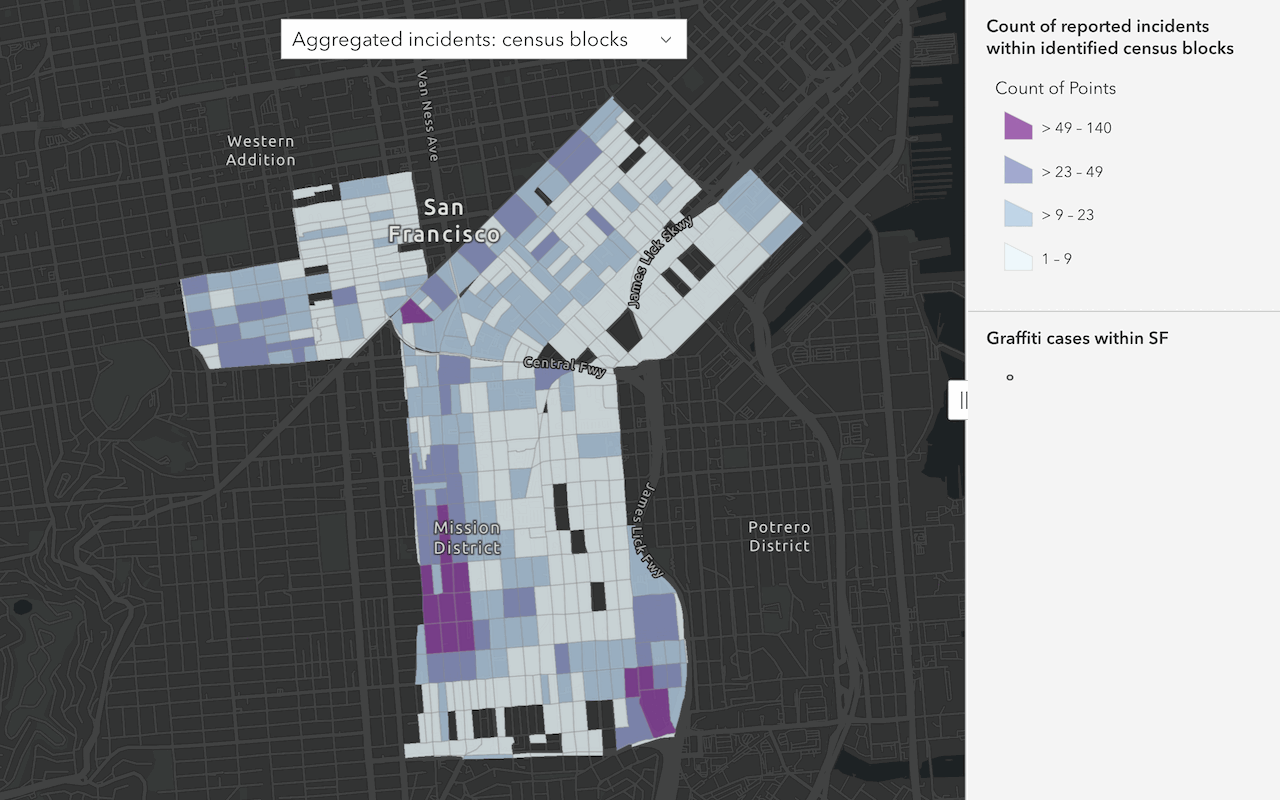
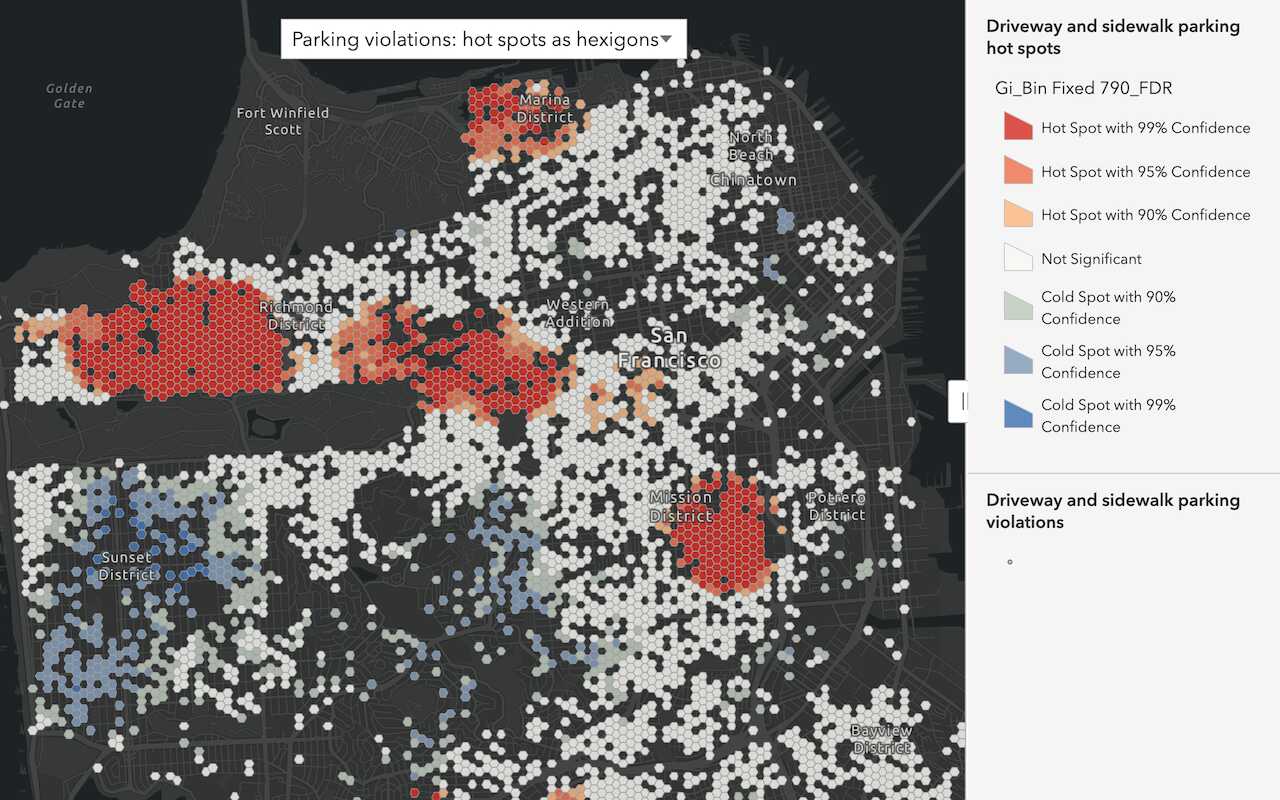
- Use spatial statistics to identify hotspots, cluster patterns, and correlations with demographic or environmental factors to inform law enforcement strategies.
- Plan utility infrastructure routes and mitigate risks like wildfires or power outages by analyzing terrain data and vegetation cover.
How does spatial analysis work?
ArcGIS supports server-side and client-side spatial analysis. The steps you use to perform an analysis depends on the type of problem you are solving, data available, and API you are using.
Client-side
Client-side analysis typically involves using APIs such as the ArcGIS Maps SDK for JavaScript
The general steps to perform client-side spatial analysis are:
- Access or create your input geometry.
- Use an API to call a geometry or 3D function.
- Data processing occurs client-side.
- Results are stored in memory.
- Display and evaluate the results.
Below is an example of performing a client-side geometry analysis to calculate the buffer of a single geometry using the ArcGIS Maps SDK for JavaScript
const bufferGeometry = geometryEngine.geodesicBuffer(geometry, 2000, "meters");
console.log("The buffer geometry is:" + bufferGeometry);Server-side
Server-side analysis involves making asynchronous requests to a server endpoint. All transactions are job requests (long transactions) and require multiple requests to the service to process the job, monitor the status, and then get the results. This is typically done using APIs such as the ArcGIS API for Python, ArcGIS REST JS, or the ArcGIS REST API. The two types of server-side analysis you can perform are feature analysis and raster analysis.
The general steps to perform server-side spatial analysis are:
- Prepare your input hosted layers or feature collections. Data is prepared as a hosted layer in your portal.
- Make a request to the feature analysis service
A spatial analysis service, also known as a feature analysis service, is a service used to perform spatial analysis operations on feature data such as finding, comparing, summarizing, analyzing patterns, and calculating geometries. or raster analysis serviceThe raster analysis service is a service that can be used to perform operations on raster data such as pattern analysis, summarization, proximity analysis, data conversion and performing deep learning analysis. .- Data processing occurs server-side.
- Results are stored as a new hosted layer.
- Display and evaluate the results.
Below is an example of performing a server-side feature analysis to calculate the buffers of all the features in a layer using the ArcGIS API for Python:
const job = await EsriGeoprocessor.submitJob(analysisURL, jobParams)
const res = await job.waitForJobCompletion({interval:5000, statusCallback: (j)=>{
console.log(`Job status: ${j.jobStatus}`)
}})
if (res.jobStatus === "job-succeeded"){
const r = await res.fetchResultData("bufferLayer")
const resultLayer = new EsriFeatureLayer({portalItem: {id: r.value.itemId}})
resultLayer.when(()=>{return resultLayer.queryExtent();}).then(res=>{view.goTo(res.extent)})
map.add(resultLayer)
}
Types of spatial analysis
ArcGIS supports four general types of spatial analysis. Each type requires following a specific workflow and supports the development of a specific type of application.
-
Geometry analysis: Perform one or more spatial operations on client side points, polylines, or polygons
A geometry is a geometric shape, such as a point, polyline, or polygon, that contains one or more coordinates and a spatial reference. to solve a geometric problem. -
Feature analysis: Perform server-side geometric and analytic operations on large numbers of feature data
Feature data is a general term for one or more features, which are records that represent real-world geographic entities, stored as a feature collection, feature layer, or hosted feature layer. with the feature analysis serviceA spatial analysis service, also known as a feature analysis service, is a service used to perform spatial analysis operations on feature data such as finding, comparing, summarizing, analyzing patterns, and calculating geometries. -
Raster analysis: Perform server-side geometric and analytic operations on raster data
A raster is a matrix of cells (or pixels) organized into rows and columns (or a grid) where each cell contains a value representing information, such as temperature. Rasters include digital aerial photographs, imagery from satellites, digital pictures, and scanned maps. with the raster analysis serviceThe raster analysis service is a service that can be used to perform operations on raster data such as pattern analysis, summarization, proximity analysis, data conversion and performing deep learning analysis. . -
3D visual analysis: Calculate and display spatial information derived from client-side terrain, buildings, and other 3D objects contained within a scene
A scene is a collection of layers that are displayed in 3D. It is typically composed of a basemap layer, data layers, and 3D data. .
Comparison
The table below provides a quick comparison between the types of analyses:
| Type of analysis | Execution mode | Data size | Input data types | Output data types | Store results | Supporting APIs |
|---|---|---|---|---|---|---|
| Geometry analysis | Client-side | Smaller datasets | Geometry | Geometry, Boolean, Number | False |
|
| Feature analysis | Server-side | Larger datasets | Feature collections or hosted feature layers | Feature collection or hosted feature layer | True |
|
| Raster analysis | Server-side | Larger datasets | Hosted imagery layers | Hosted imagery layer | True |
|
| 3D visual analysis | Client-side | Smaller datasets | points, point cloud, 3D objects, or integrated mesh. | Analysis overlay | False |
|
Terminology
Below is a list of the common terms that are used to perform spatial analysis:
-
Geometry: A geometry is a geometric shape that contains one or more coordinates
A coordinate is a value that denotes the location of a vertex. Coordinates can represent 2D ( and a spatial referencex,y) or 3D (x,y,z) space. The meaning of thex,y,zcoordinates are determined by a coordinate system.A spatial reference is a set of parameters, typically defined by a WKID, that define the coordinate system and spatial properties for geographic data. Applications use a spatial reference to correctly display the position of geographic data in a map or scene. . PointsA point is a type of geometry containing a single set of contain a single set of coordinates, polylinesx,ycoordinates and a spatial reference.A polyline is a type of geometry containing ordered point coordinates and a spatial reference. contain two or more coordinates, and polygonsA polygon is a type of geometry containing an array of rings and a spatial reference. Each ring contains an array of point coordinates, where the first and last point are the same. contain three or more coordinates. Geometries are used to define the shape and position of graphics and features. -
Feature: A feature is a single record, also known as a row, that represents a real-world entity. Features can be composed of a geometry (point, polyline, or polygon) and attributes or only attributes without geometry, and are typically stored in a feature layer, table or a feature collection.
-
Raster: A raster is a matrix of cells (or pixels) organized into rows and columns (or a grid) where each cell contains a value representing information, such as temperature. Rasters include digital aerial photographs, imagery from satellites, digital pictures, and scanned maps.
-
Hosted layer: A hosted layer is an item
An item, also known as a content item, is a resource stored in a portal such as a web map, hosted layer, style, script tool, file, or notebook. in a portalArcGIS portal, also known as a portal, is a website with applications and tools that can be used to create, manage, access, and share geospatial content and data. It supports security and authentication, developer credentials, content and data service management, user and group management, and site administration. A portal can be hosted in Esri's infrastructure or your own infrastructure. that contains the properties and settings for a hosted data serviceA service, also known as an ArcGIS service, is software that supports an ArcGIS REST API and provides geospatial functionality or data. A service can be hosted by Esri or in ArcGIS Enterprise. or a layer in a hosted data service. A hosted layer is used to manage the properties of the item and the hosted data service settings. The most common types of hosted layers are hosted feature layers, hosted vector tile layers, hosted map tile layers, and hosted imagery layers. -
Portal: A portal, also known as an ArcGIS portal, is a website with tools that can be used to create, manage, access, and share geospatial content and resources. It supports security and authentication, content and data service management, user and group management, and site administration. A portal contains tools and applications such as the content manager, organization manager, Map Viewer, and Scene Viewer that can be used to create and manage content, import data, create developer credentials, manage users and groups, and manage the overall site.
-
Job request: A job request is an HTTPS request to a service that starts a server-side operation (or job) with a long duration. A job request returns a job ID that is used by client applications to make subsequent HTTPS requests to determine job status updates and, when it is complete, to download the final job output. Job requests are used for longer, typically complex operations
-
Access token: An access token is an authorization string that provides secure access to content, data, and functionality in ArcGIS location services. The format is either an API key or an OAuth 2.0 token. Access tokens define the scope and permissions available to your application, and their capabilities vary based on the type of authentication used to obtain them. There are three types of authentication that can be used to obtain an access token: API key authentication, User authentication (formerly ArcGIS identity), and App authentication.
-
Map Viewer: Map Viewer is a browser-based mapping tool that can view, create, and save web maps
A web map is a map stored as a JSON object that defines properties such as the basemap layer, data layers, layer styles, and pop-up styles. Its JSON structure is defined by the web map specification. . Map Viewer can be used to perform common GIS tasks, such as to explore the contents of a web map, change the basemapA basemap is the foundational layer and data that provides the overall visual and geographic context for a map or scene. It typically includes geographic features and labels for land, water, roads, buildings, cities, places, and administrative boundaries, but can also include raster data such as satellite and areal images. , add data layersA data layer is a layer that references geographic data from a file or a service and is used to visualize the data in a map or scene. and stylesA style is the visual definition of how geographic data is displayed in a map including colors, backgrounds, outlines, labels, and other visual elements. Each style emphasizes a specific type of cartographic theme and data. , perform measurements, and execute different types of data analyses.
Tutorials

Find spatial relationships

Calculate geometries

Find length and area

Display projected geometries

Find data sources
Discover data in ArcGIS that you can use for feature analysis.


Enrich data sources
Enrich data with demographic information and local business facts using the spatial analysis service.
Find and extract data
Find data with attribute and spatial queries using find analysis operations.
Summarize data
Aggregate and summarize features
Discover patterns in data
Find patterns and trends in data using spatial analysis operations.

Perform a feature analysis

Perform an analysis using raster operations

Create a raster function template

Display a viewshed
Perform and display a viewshed analysis in a 3D scene.

Display a line of sight
Perform and display a line of sight analysis in a 3D scene.

Measure a distance in 3D
Evaluate the horizontal, vertical, and direct distances between two points in a 3D scene.